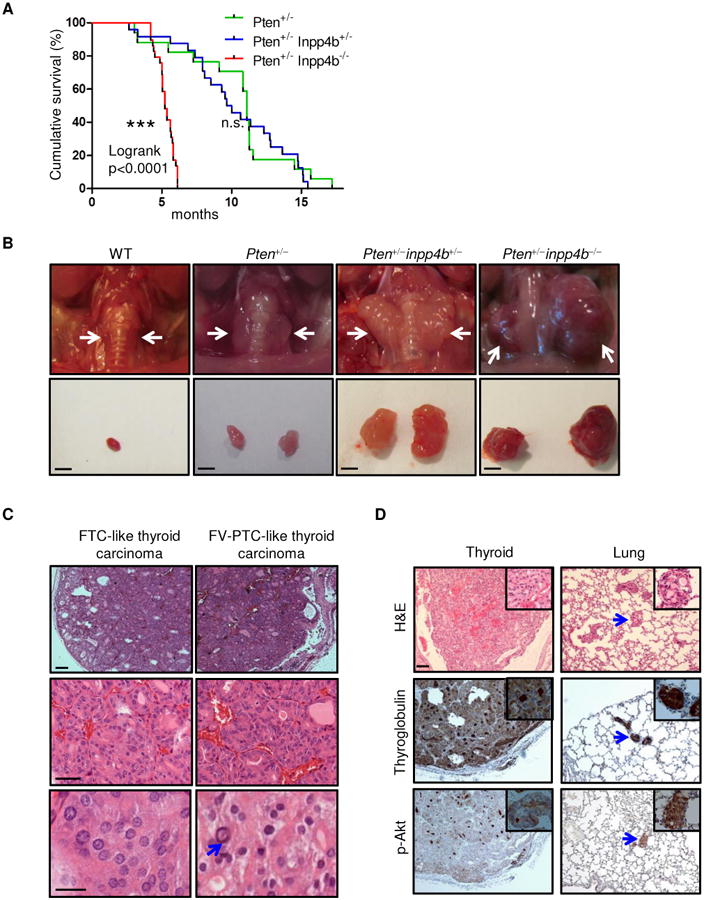
Figure 2. Loss of Inpp4b in Pten+/− mice leads to follicular thyroid carcinoma.

A. Kaplan-Meier survival curve of Pten+/−, Pten+/−Inpp4b+/− and Pten+/−Inpp4b−/− mice. B. Top panel: gross anatomy of representative thyroids from mice of the indicated genotypes. White arrows point to the location of the thyroid. Bottom panel: dissected thyroids from mice of the indicated genotypes; Scale bar, 2mm. C. Left panel: H&E staining of a follicular thyroid carcinoma (FTC)-like thyroid tumor which is thinly encapsulated with microfollicular architecture. Right panel: H&E staining of a follicular variant of papillary thyroid carcinoma (FV-PTC)-like thyroid tumor. Middle and bottom panels highlight nuclear atypia characteristic of FV-PTC, including intranuclear pseudoinclusions (arrow). Scale bars, top and middle panels: 100μm, bottom panel: 20 μm, D. Top panel: H&E staining of thyroid tumor and lung metastases from Pten+/−Inpp4b−/− mice; middle & bottom panel: thyroglobulin and p-Akt (Ser473) staining. Scale bar, 100μm. Insets show thyroid cancer cells. Blue arrows point to the location of the metastases in the lungs.
