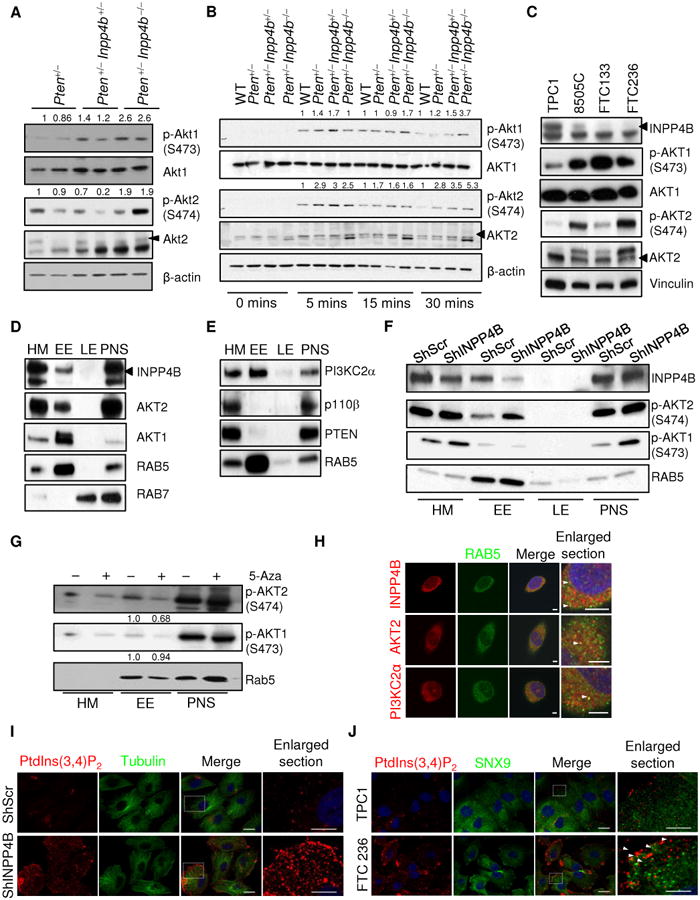
Figure 4. Loss of Inpp4b in Pten+/− cells leads to increased Akt activation.

A-B. Western blot analysis of lysates from Pten+/− (n=3; ∼10-11months), Pten+/−Inpp4b+/− (n=2; ∼6-8months) and Pten+/−Inpp4b−/− (n=3; ∼6 months) thyroid tissues (A), lysates from immortalized MEFs after serum starvation-restimulation. The MEFs were stimulated with serum for the indicated amount of time. (B). C. Western blot analysis of total lysate from different thyroid cancer cells. Please note that the AKT2 antibody used in A-B (5239) is different from C (3063), resulting in the appearance of different unspecific bands. Arrows indicate specific band (see also Methods). D-E. Western blot analysis of cell fractions from TPC1 cells. HM: cytosolic/heavy membranes; EE: early endosome: LE: late endosome; PNS: postnuclear supernatant. Arrow indicates specific band. AKT2 antibody used is (3063). F. Western blot analysis of phosphorylated Akt1 and phosphorylated Akt2 in different cell fractions derived from TPC1 cells infected with either a non-targeting shRNA or an shRNA that targets INPP4B. G. Western blot analysis of phosphorylated Akt1 and phosphorylated Akt2 in different cell fractions derived from FTC236 cells treated with either DMSO or 3uM 5-Aza for 5days.
H. Immunofluorescence of PI(3,4)P2 and tubulin in TPC1 cells infected with either a non-targeting shRNA or an shRNA that targets INPP4B. Scale bars, 20 μm. I. Immunofluorescence of INPP4B, AKT2, PI3K-C2α and RAB5 in TPC1 cells. Scale bars, 5μm. J. Immunofluorescence of PI(3,4)P2 and SNX9 in TPC1 and FTC236 cells. Scale bars, 20 μm.
