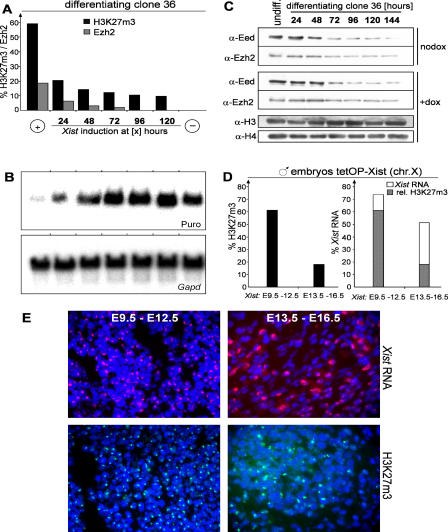
Figure 4. Restriction of H3K27m3 Establishment and Transcriptional Silencing in Differentiation.
(A) Initiation of H3K27m3 during clone 36 ES cell differentiation. Xist expression was induced at the beginning (+) or at various time points (24 to 120 h) after the start of differentiation, or not induced (−). The percentages of interphase cells showing H3K27m3 (black bars; n > 700) and Ezh2 (grey bars; n > 200) staining were determined at day 12 of differentiation.
(B) Initiation of transcriptional silencing during differentiation was assessed by Northern blot analysis of PGKpuromycin (puro) and Gapd as a loading control in parallel cultures as described for (A).
(C) Western analysis of Ezh2 and Eed protein levels during differentiation of clone 36 ES cells after induction with retinoic acid. Histones H3 and H4 were used as a loading control.
(D) Establishment of H3K27m3 during embryonic development. Xist expression was induced from the single X chromosome of male Xist-tetOP embryos (see text) for 3 d (E9.5–12.5 and E13.5–16.5). The percentage of cells with H3K27m3 staining in interphase (left) and clusters of Xist RNA (right, open bars) are given (n > 300). Grey areas indicate the proportion of H3K27m3-positive cells to Xist-positive cells.
(E) Xist RNA FISH (top) and H3K27m3 (bottom) staining of histological sections prepared from neck connective tissue of embryos described in (C).

