Figure 1.
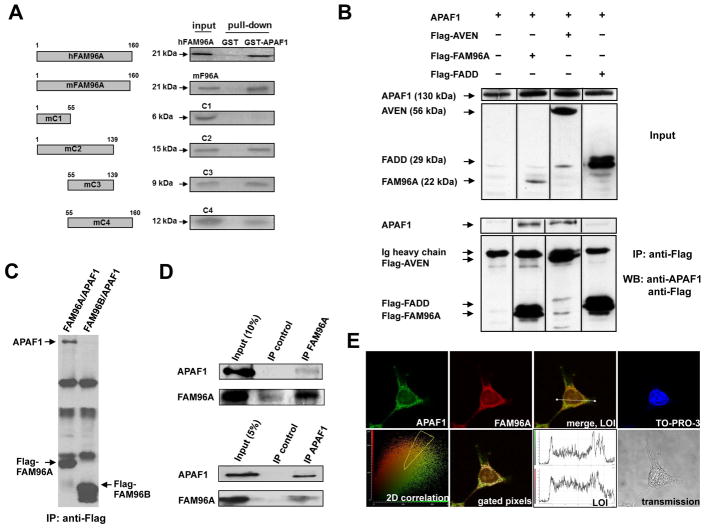
FAM96A interacts with APAF1. (A) Human and mouse full-length FAM96A and mouse FAM96A deletion mutants (C1–C4) were in-vitro translated and labeled with 35[S]-methionine. After incubation with bacterially expressed GST-APAF1SΔWD40 or GST alone, glutathione-sepharose beads were used to precipitate GST fusion proteins and their complexing partners. The C3 mutant containing mFAM96A aa 55–139 was sufficient and necessary for in-vitro APAF1 binding. (B) Flag-tagged hFAM96A was co-transfected into 2×10⁶ HEK293T cells with hAPAF1S. Immunoprecipitation (IP) with anti-Flag-coupled agarose beads and subsequent Western blot analysis showed co-immunoprecipitation of APAF1S with Flag-FAM96A and the APAF1-binding protein Flag-AVEN (caspase activation inhibitor; positive control) but not with the cytosolic adaptor protein Flag-FADD (negative control). (C) HEK293T cells were co-transfected with Flag-FAM96A or Flag-FAM96B together with APAF1. Following protein lysate preparation, immunoprecipitation with anti- Flag-coupled agarose beads and subsequent Western blot analysis showed co-immunoprecipitation of APAF1 with Flag-FAM96A but not with FAM96B. (D) Upper panel: IP of endogenous FAM96A in HEK293T cells using a self-raised rabbit anti-mFAM96A antiserum that cross-reacts with hFAM96A (see Supplementary Material section and Supplementary Figure 2) and rabbit IgG as negative control. Co-immunoprecipitated endogenous APAF1 protein was detected by Western blotting. Lower panel: Endogenous FAM96A was co-immunoprecipitated with endogenous APAF1 in HEK293T cell lysates. An anti-FLIP antibody served as a negative isotype IP control. (E) Detection of endogenous APAF1 (using rat anti-APAF1 and Alexa Fluor [AF] 488-anti-rat IgG; green) and FAM96A (using rabbit anti-mFAM96A and AF546-anti-rabbit IgG antibodies; red) in a HEK293T cell. Co-localization is indicated by the yellow color in the merged image. The lower left panel shows a 2D correlation diagram in which the pixels positive for both FAM96A and APAF1 were gated (yellow polygon) for representation in the panel labeled “gated pixels”, where white color indicates co-localization in the cytoplasm. The distributions of green (APAF1) and red (FAM96A) fluorescence intensities along the line in the merged image (LOI; line-of-interest) are shown in the upper and lower panels, respectively, of the panel labeled LOI. Lower right panel: transmission microscopic image of the analyzed cell.

