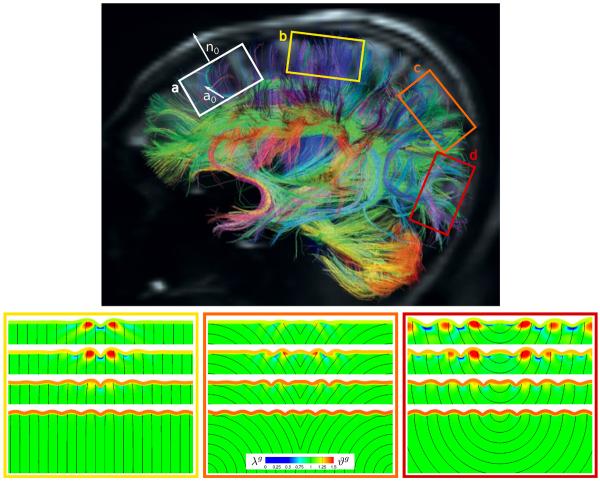
Fig. 6.
Growth in brain slices for anisotropic axonal orientation at varying growth contrasts. Diffusion spectrum imaging of the adult human brain reveals regionally varying cortical normals n0 and axonal orientations a0, which induce anisotropic gray and white matter growth (a), modified with permission from [3]. Axons display radially straight I-shaped (b), radially curved V-shaped (c), and radially curved U-shaped (d) orientations. The growth contrast between gray and white matter varies between 10−2.5, 10−2, 10−1.5, 10−1, from top to bottom. The black streamtraces illustrate the local axonal orientation a0; the color contours indicate the local axonal growth λg and number of cortical neurons ϑg.

