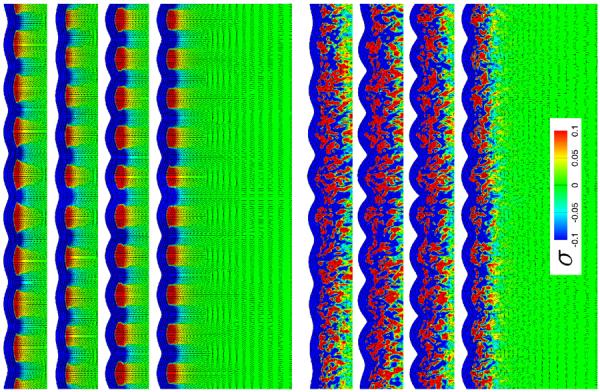
Fig. 7.

Stress in brain slices for isotropic white matter growth, top, and anisotropic white matter growth with randomly isotropic axonal orientation, bottom, at varying growth contrasts. For each set, the growth contrast between gray and white matter varies between 10−2.5, 10−2, 10−1.5, 10−1, from top to bottom. The black lines illustrate the directions of maximum principal stress; the color contours indicate the maximum principal stress along this direction.
