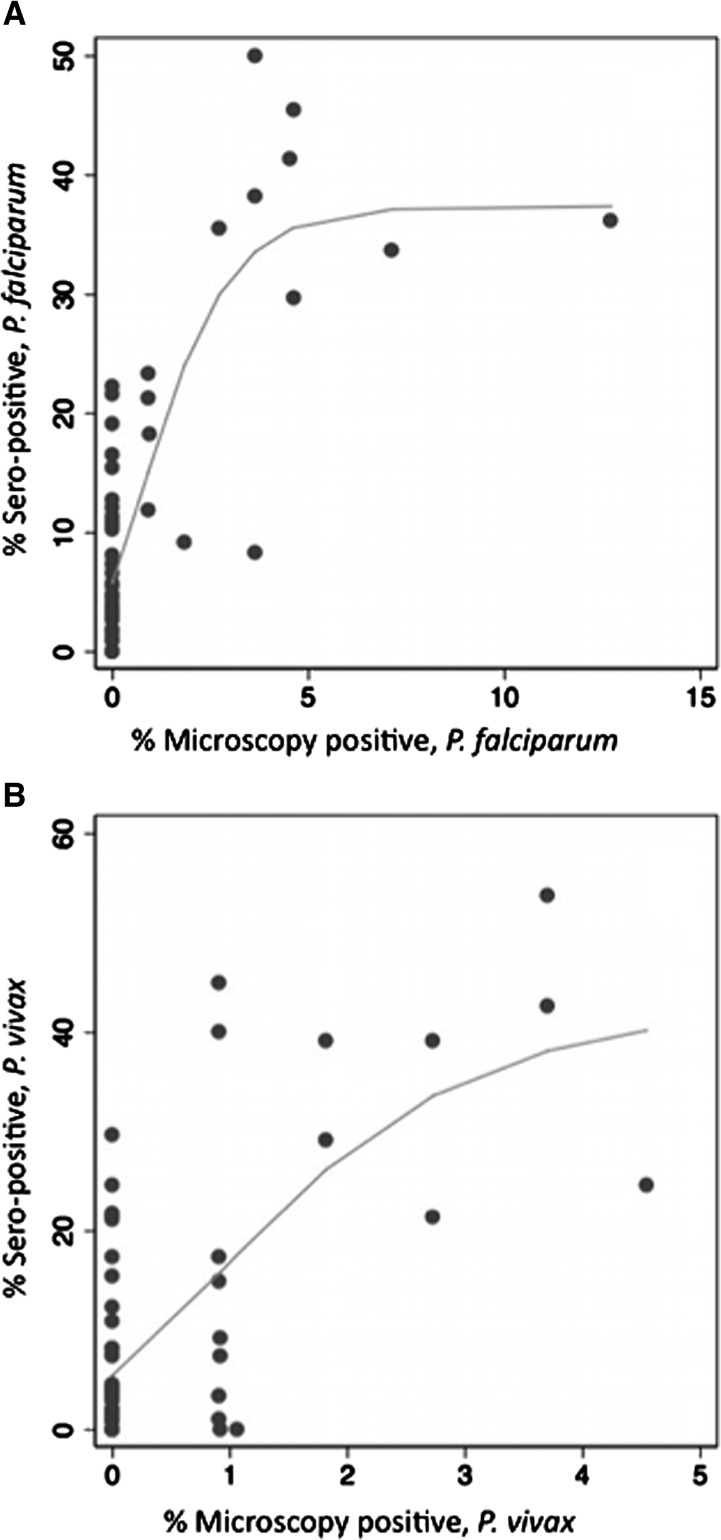
Figure 1.
School-level seroprevalence and prevalence of infection detected by microscopy for Plasmodium falciparum (A) and P. vivax (B). Scatter plots are presented for 56 schools with P. falciparum data and 62 schools with P. vivax data, restricted to those with serology results from ≥ 50 children. Nonlinear regression identified a Gompertz function as best fit to P. falciparum (R2 = 0.810), and to P. vivax data (R2 = 0.657).

