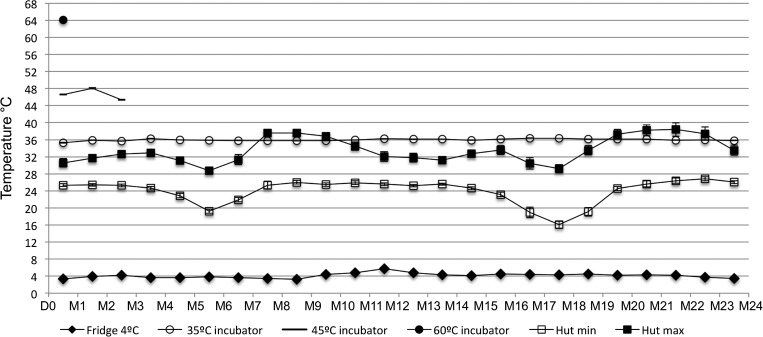
Figure 4.
Monthly mean (95% confidence interval [CI]) temperatures recorded in the incubator, refrigerator, and hut over the 2-year study period, from July 23, 2012 to July 23, 2014. Empty squares are the average of daily minimum temperatures and black solid squares are the average of daily maximum temperatures recorded in the hut. D0 = day 0 (July 23, 2012), M = month.

