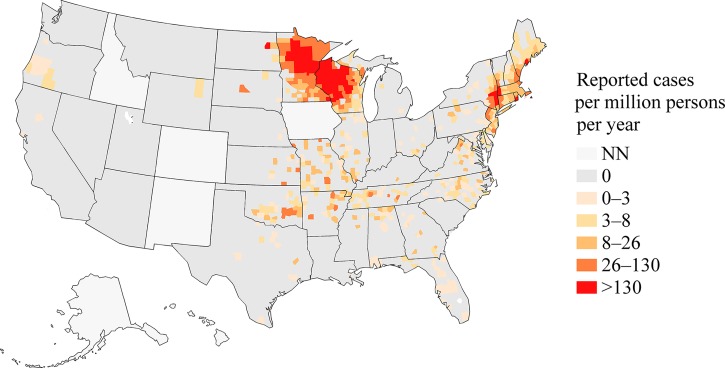
Figure 2.
A map of reported incidence rates, the number of incident cases per million persons at risk per year, of anaplasmosis in the counties of the United States, 2008–2012. States where the disease was not notifiable for the duration of 2008–2012 are shaded with the “NN” category. The number of incident cases is from the Nationally Notifiable Diseases Surveillance System, and the number of person-years at risk is from the U.S. Census Bureau.

