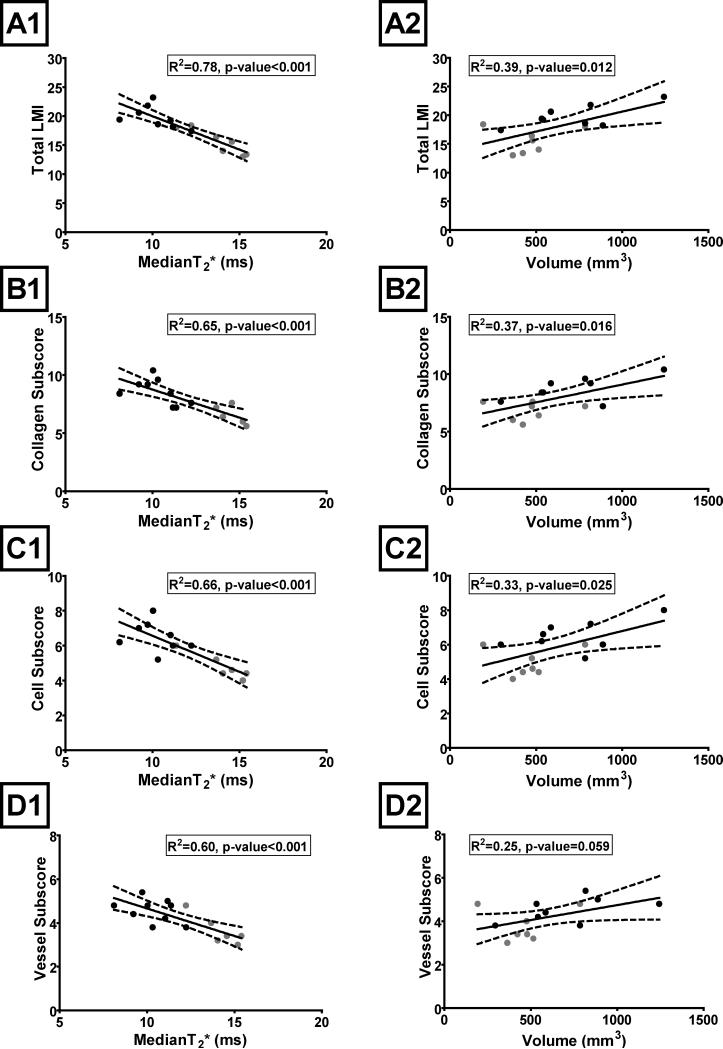
Figure 1.
The healing ligament histology scores (A- Total LMI, B- Collagen Sub-score, C- Cell Sub-score, and D- Vessel Sub-score) as a function of ligament median T2* value (A1, B1, C1, and D1) and volume (A2, B2, C2, and D2) in the linear regression models. Dashed lines represent 95% confidence interval. The ligaments that received bridge-enhanced ACL repair are depicted with black circles and ligaments that were transected and left to heal naturally are depicted with gray circles.

