Figure 3.
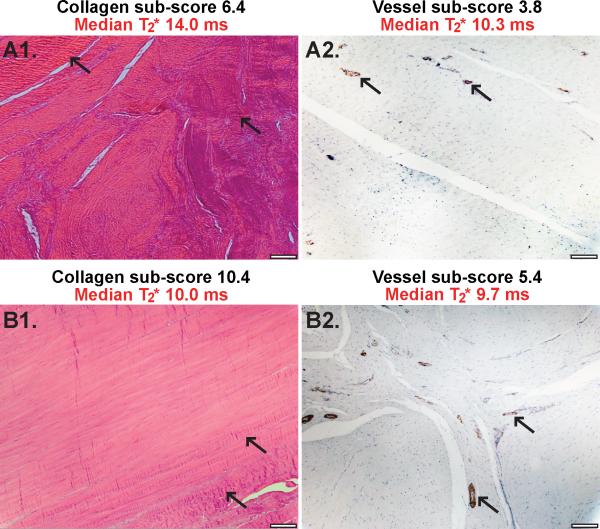
A1) Example H&E stained polarized image with a collagen sub-score of 6.4 and median ligament T2* of 14 ms. Arrows indicate areas with collagen crimp not distinctly aligned with fiber longitudinal axis. A2) Example SMA stained image with a vessel sub-score of 3.8 and median ligament T2* of 10.3 ms. Arrows indicate smooth muscle like actin rich muscularis layer around arterioles visible in the interfascicular regions. B1) Example H&E stained polarized image with a collagen sub-score of 10.4 and median ligament T2* of 10 ms. Arrows indicate collagen crimp aligned with fiber longitudinal axis. B2) Example SMA stained image with a vessel sub-score of 5.4 and a median ligament T2* of 9.7 ms. Arrows indicate smooth muscle like actin rich muscularis layer around arterioles visible in the interfascicular regions. All histological images at 10X magnification, scale bars indicate 100μm.

