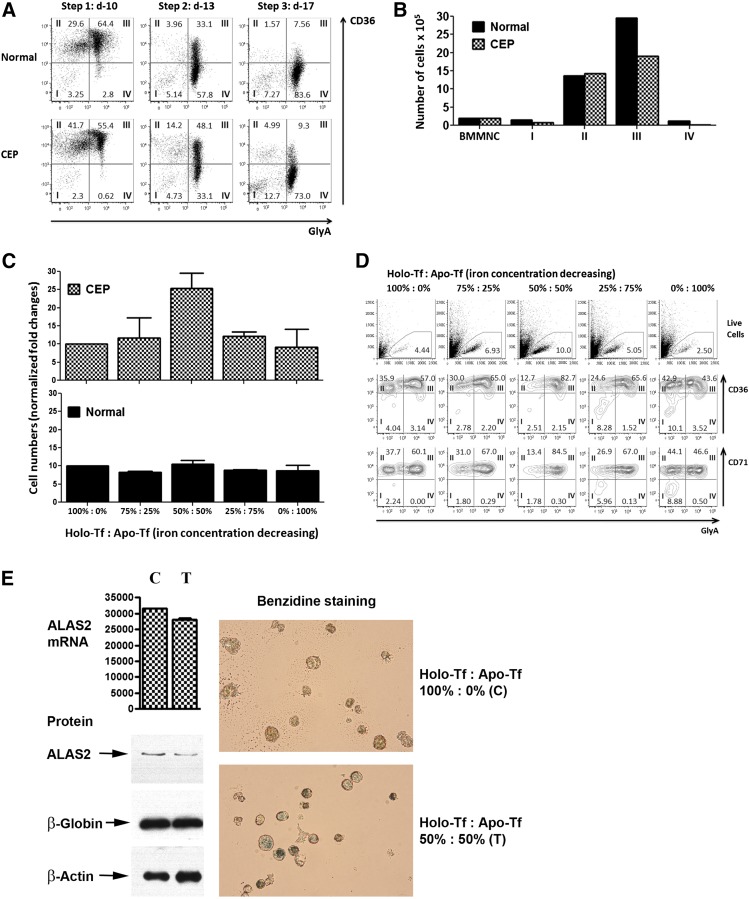
Figure 2.
Erythroid cell growth and maturation of CEP and normal bone marrow. (A) Flow cytometric profiles of control and CEP marrow cells cultured in standard iron-replete conditions (100% holo-Tf [holo-transferrin]; 8.54-9.52 μM iron). Although the erythroid cells from CEP patient 2 fully matured from stages I to IV (defined by the sequential gain of CD36 and then GlyA expression and the subsequent loss of CD36 expression), there were lower percentages of erythroid cells in stage III on day 10 (55.4% vs 64.4% in control cultures) and in stage IV on days 13 and 17 (33.1% and 73.0% vs 57.8% and 83.6%, respectively). Similar results were also seen in the studies of marrow cells from CEP patient 1 (supplemental Figure 1A). (B) Absolute numbers of erythroid cells in cultures containing 100% holo-Tf. Cultures of marrow cells from CEP patient 2 at day 10 have fewer cells than control cultures. This is mainly due to the decreased numbers of erythroid cells in stage III (19.0 × 10⁵ vs 29.6 × 10⁵), suggesting that CEP erythroid cells die when transiting to or in stage III. All cultures were initiated (day 0) with 2.0 × 10⁶ bone marrow mononuclear cells. Similar results were also seen in marrow culture studies of CEP patient 1 (supplemental Figure 1B). (C) Total number of CEP erythroid cells on culture day 10 in media containing different ratios of holo-Tf to apo-Tf, as stated in Study design. The number of erythroid cells in cultures containing 100% holo-Tf was arbitrarily designated as 10 so that data from CEP patients 1 and 2 could be combined and both increases and decreases reported. Maximal erythroid growth occurred with 50% holo-Tf /50% apo-Tf. In this condition of partial iron restriction, there was a 2.5 ± 0.4-fold increase in the numbers of erythroid cells vs 0.9 ± 0.5- to 1.2 ± 0.1-fold changes in the other conditions. In contrast, the numbers of normal erythroid cells on culture day 10 did not change significantly when iron delivery is restricted. (D) Iron restriction also improves the erythroid maturation of CEP marrow cells. On culture day 10, a greater proportion of CEP patient 2’s cells were GlyA+ (stages III and IV) in the cultures containing 50% holo-Tf /50% apo-Tf compared with the other iron conditions (84.9% vs 47.1-67.2%). Comparable results were seen on culture days 13 and 17 (data not shown). Marrow culture studies of CEP patient 1 yielded similar data (supplemental Figure 1C). In contrast, the numbers of normal erythroid cells on culture day 10 progressively decreased when iron delivery was restricted (supplemental Figure 1D). (E) Expression of ALAS2 mRNA and protein in CEP cells during erythroid differentiation. With iron restriction (50% holo-Tf/ 50% apo-Tf; lane T), there is a slight reduction in ALAS2 mRNA (as normalized to β-actin) on culture day 10 (28.1 × 10³ vs 31.6 × 10³ in 100% holo-Tf; lane C; P = .21). More importantly, iron restriction dramatically reduces the amount of ALAS2 protein, confirming its primary effect on the translation of ALAS2 RNA to protein. On culture day 10, the intensity of ALAS2 (normalized to β-actin) in 50% holo-Tf/50% apo-Tf (lane T) is 43.1% of the intensity of ALAS2 in 100% holo-Tf (lane C). Globin protein is similar under both iron conditions. Also, CEP cells cultured in 50% holo-Tf/50% apo-Tf fully hemoglobinize as shown here by benzidine stains and in supplemental Figure 1E by Wright-Giemsa stains from culture day 13. These studies only used marrow from patient 2, as insufficient cells were available from patient 1.

