

Abstract
Gait control depends in part on cognition. This study aims to examine the separate and combined effects of episodic memory and executive function impairments on the mean value and the coefficient of variation (CoV) of stride time among non-demented older community dwellers. Based on a cross-sectional design, 1458 older community dwellers without dementia (70.6 ± 4.9 years; 49.2 % female) were recruited and separated into cognitively healthy individuals (CHI) and individuals with cognitive impairment. A score ≤5/6 on the Short Mini-Mental State Examination defined episodic memory impairment. Impaired executive function was defined by errors on the clock-drawing test. Mean value and CoV of stride time were measured by the GAITRite® system. A total of 517 participants (35.5 %) had cognitive impairment in at least one cognitive domain. Participants with memory impairment (P = 0.006) and those with combined cognitive impairments (P < 0.001) had greater (i.e., worse gait performance) mean value of stride time (P = 0.006) compared to CHI. Participants with combined cognitive impairment had a greater CoV of stride time (i.e., worse gait performance) compared to CHI (P = 0.004) and to those with separate memory impairment (P = 0.037). Among participants with combined cognitive impairments, mean value and CoV of stride time had the highest effect size (respectively, effect size = 0.49 [95 % confidence interval (CI) 0.27;0.71] and effect size = 0.40 [95 %CI 0.18;0.62]). Participants with episodic memory or executive impairments had a greater mean value and CoV of stride time compared to those with no cognitive impairment. Combined episodic memory and executive impairments exceeded the sum of separate impairments on gait performances, suggesting a complex interplay going beyond a simple additive effect.
Keywords: Memory, Executive functions, Cognitive impairment, Gait, Older adults
Introduction
Gait is considered as an automatic and rhythmic motor activity whose the control depends in part on cognition (Montero-Odasso et al. 2012; Scherder et al. 2007). In the past decade, a close relationship has been highlighted between gait control and specific cognitive domains (Montero-Odasso et al. 2012; Scherder et al. 2007; Watson et al. 2010). In particular, episodic memory and executive performances have been separately associated with gait performances among cognitively healthy individuals (CHI) and patients with mild cognitive impairment (MCI) and with dementia (Montero-Odasso et al. 2012; Scherder et al. 2007; Watson et al. 2010; Hausdorff et al. 2005; Allali et al. 2010; Beauchet et al. 2012).
Slower gait speed and increased gait variability represent two gait disturbances commonly associated with episodic memory and executive impairments (Montero-Odasso et al. 2012; Ble et al. 2005). Based on a large population-based cross-sectional study and a meta-analysis (Beauchet et al. 2014a), it has been reported that greater (i.e., worse gait performance) stride-to-stride variability of stride time (i.e., gait cycle duration)—a measure of the reliability of lower-limb movements—was the motor phenotype of cognitive impairment among older community dwellers without dementia (Beauchet et al. 2014a, b). This study suggested a complex interplay between episodic memory and executive function (EF) impairments on gait variability going beyond a simple additive effect, as increased stride time variability was greater than the sum of the combined effects of these both separate cognitive impairments. However, to the best of our knowledge, no study has confirmed this likely effect of cumulated cognitive impairments on gait variability.
Because episodic memory and EF impairments are both common cognitive impairments in older adults with and without dementia (Montero-Odasso et al. 2012; Scherder et al. 2007; Harada et al. 2013; Lin et al. 2013), examining the separate and the combined effects of these both cognitive impairments on gait parameters would be helpful to better understand the contribution of cognition to gait disorders in normal and pathological aging. This study aims to examine the separate and the combined effects of episodic memory and executive impairments on the mean value and the coefficient of variation (CoV) of stride time among older community dwellers without dementia.
Materials and methods
Population
A total of 1458 non-demented community dwellers using a cross-sectional design were recruited during a free medical examination in the French Health Examination Center in Lyon, France, between April 2010 and April 2012. All participants were registered on the electoral list of the city of Lyon. First, they were contacted by mail and a free medical examination was proposed. The volunteers returned a phone call to manifest their intention to perform this medical examination, and an appointment was booked in the French Health Examination Center of Lyon. At the beginning of the medical examination and based on selection criteria, a physician proposed participation in the study. Inclusion criteria were having a quantitative gait assessment with GaitRite® system; no history of dementia and no use of anti-dementia drugs; no acute medical illness during the past month; no neurological diseases including Parkinson’s disease, cerebellar disease, myelopathy, peripheral neuropathy, and major orthopedic diagnoses (e.g., osteoarthritis) involving the lumber vertebra, pelvis or lower extremities; ability to walk 6 m unassisted; ability to understand and speak French; and age 65 years and over.
Clinical assessment
A comprehensive medical examination collected age, gender, height, weight, the number of drugs taken daily, and the use of psychoactive drugs including benzodiazepines, antidepressants, or neuroleptics. Depression symptoms were evaluated with the 4-item Geriatric Depression Scale (GDS) score (Shah et al. 1997). A score ≥1 indicated the presence of depression symptoms. Body mass index (BMI, in kilogram per square meter) was calculated using anthropometry measurements (i.e., weight in kilograms and height in meters). The maximal isometric voluntary contraction (MVC) handgrip strength was measured with computerized hydraulic dynamometers (Martin Vigorimeter, Medizin Tecnik, Tutlingen, Germany) (Beauchet et al. 2011a, b). The test was performed three times with the dominant arm. The mean value of MVC of all trials was used in the present analysis. Lower-limb proprioception was measured with a graduated tuning fork placed on the tibial tuberosity (Rossat et al. 2010). The mean value obtained for the left and right sides was used. Distance binocular vision was measured at 5 m with a standard Monoyer letter chart (Lord et al. 1994). Vision was assessed with corrective lenses if needed. Fear of falling was assessed using a single question: “Are you afraid of falling?” with a binary answer (i.e., yes versus no) (Ayoubi et al. 2014). History of falls over the past year was recorded using a standardized questionnaire based on 22 items exploring the number, delay and place of falls (i.e., inside or outside the participant’s house), the evoked causes and circumstances of falls, and all physical traumatisms (Rossat et al. 2010). A fall was defined as unintentionally coming to rest on the ground, floor, or other lower level and not as the result of a major intrinsic event or an overwhelming hazard (Beauchet et al. 2011a, b). Thus, falls resulting from acute medical events and/or external force were excluded from the analysis.
Episodic memory was assessed using the Short form of the Mini-Mental State Examination (SMMSE) with scores ranging from 0 to 6 (i.e., best) (Haubois et al. 2013). A SMMSE score ≤5 was used to define impairment in episodic memory. SMMSE was developed and validated for the screening of dementia. The best cutoff value between sensitivity and specificity of SMMSE score for diagnosing dementia was ≤4 (Haubois et al. 2013). In the present study, we purposefully did the choice to change the cutoff value because we included participants without history of dementia and use of anti-dementia drugs. This a priori choice allowed selecting specifically early stages of cognitive decline, such as mild cognitive impairment and mild dementia. A total of 221 (15.2 %) participants had a SMMSE score = 5 and over, and 129 (8.8 %) had a SMMSE score = 4. EF was assessed using the clock-drawing test. EF performance is usually identified through a comprehensive neuropsychological battery. However, this kind of assessment may not be available outside specialized centers and may be time prohibitive for routine use in all patients. Considering the practical limitations of a comprehensive neuropsychological assessment, we used the clock-drawing test because this test can be routinely administered during a free medical examination in the French Health Examination Center. EF impairment was considered if any error was made in the drawing of the circle or the position of the numbers and/or the hands of the clock (Sunderland et al. 1989).
Mean value and coefficient of variation (CoV = (standard deviation/mean) × 100) of stride time were measured at self-selected speed during steady-state walking using GAITRite® system (GAITRite Gold, CIR Systems, PA) in a 6-m corridor. We focused on these stride time parameters because both of them have been previously linked with cognition (Montero-Odasso et al. 2012; Hausdorff et al. 2005, Beauchet et al. 2012, 2014a, b) and with gait control (Allali et al. 2010; Annweiler et al. 2013; Annweiler et al. 2014; Beauchet et al. 2014a, b). The GAITRite® system is an electronic walkway-integrated and pressure-sensitive electronic surface of 5.6 × 0.89 m, with an active surface length of 4.8 m, connected to a personal portable computer via an interface cable. Participants walked one trial in a quiet, well-lit environment wearing their own footwear according to European guidelines for spatio-temporal gait analysis in older adults (Kressig and Beauchet 2006). They started walking in the room of clinical examination that was continuous with the corridor, which allowed having 1 m of acceleration and deceleration phases, respectively. Before their assessment, all participants were contacted by mail and informed not to wear high-heel shoes.
Standard protocol approvals, registrations, and patient consents
Participants were included after having given their written informed consent for research. The study was conducted in accordance with the ethical standards set forth in the Helsinki Declaration (1983). The study was approved by Lyon Sud-Est III local Ethical Committee, France.
Statistical analysis
The participants’ characteristics were summarized using means and standard deviations or frequencies and percentages, as appropriate. Normality of data distribution was checked using a skewness-kurtosis test. As the number of observations was >40 for each group, no transformations were applied to the variables of interest. Participants were classified into four groups, as follows: CHI, individuals with separate episodic memory, individuals with separate executive function impairment, and individuals with combined episodic memory and EF impairments. First, between-group comparisons were performed using one-way analysis of variance (ANOVA) with Bonferroni corrections or chi-square test, as appropriate. Second, univariate and multiple linear regression analyses were performed to examine the association between each cognitive condition analyzed separately (i.e., CHI, episodic memory, or EF, or episodic memory plus executive impairments; independent variables) and stride time parameters (i.e., mean value and CoV) (dependent variables) adjusted on participants’ characteristics (i.e., age, gender, number of drugs used per day, use of psychoactive drugs, depression symptoms, BMI, lower-limb proprioception, distance vision score, and handgrip strength). For the condition “no cognitive impairment,” the reference group was the participants with at least one cognitive impairment, whereas for the “conditions with cognitive impairment,” the reference group was the CHI. Third, we calculated the effect size from the mean values and standard deviations of each stride time parameter (i.e., mean value or CoV) in participants with cognitive impairments (i.e., separate episodic memory impairment, separate EF impairment, or combined episodic memory and EF impairments). An effect size calculator worksheet was used to derive effect size and standard error from mean and standard deviation and size of each group (Coe’s calculator retrieved 25 March 2015 from http://www.cemcentre.org/evidence-basededucation/effect-size-calculator). Effect size is a quantitative measure of the strength of a phenomenon (a larger absolute value indicates a stronger effect). We graphed the effect size using Review Manager version 5.1, The Nordic Cochrane Centre, Copenhagen, Denmark. This approach was chosen to identify the largest differences of stride parameters associated with each cognitive status, the reference group being the participants with no cognitive impairment. P values less than 0.05 were considered statistically significant. All statistics were performed using SPSS (version 19.0; SPSS, Inc., Chicago, IL).
Results
A total of 517 (35.5 %) participants presented impairment in at least one cognitive domain: 244 (16.7 %) had only episodic memory impairment, 189 (13.0 %) had only EF impairment, and 84 (5.8 %) had combined cognitive impairments. Participants with separate EF impairment were older than CHI (P < 0.001); those with combined episodic memory and EF impairments were older than CHI (P < 0.001) and participants with separate episodic memory impairment (P = 0.022) (Table 1). Number of drugs daily taken and use of psychoactive drugs significantly differed among participants (P = 0.020 and P = 0.045, respectively). Prevalence of depression symptoms was different between subgroups (P < 0.001), with higher prevalence among participants with separate episodic memory impairment (P < 0.001) and separate EF impairment (P = 0.002), as well as those with combined cognitive impairments compared to CHI (P < 0.001). The BMI was significantly different across subgroups (P = 0.008) without any significant difference between specific subgroups. Participants with combined cognitive impairments had a lower handgrip strength compared to CHI (P = 0.034) and to those with separate episodic memory impairment (P = 0.009). Participants with combined cognitive impairments had also a lower lower-limb proprioception compared to CHI (P = 0.003). Participants with separate EF impairment (P = 0.001) and those with combined episodic memory and EF impairments (P < 0.001) had lower distance vision compared to CHI. In addition, those with combined cognitive impairments had lower distance vision compared to those with separate episodic memory impairment (P < 0.001). In final, the participants with memory impairment (P = 0.006) and those with combined cognitive impairments (P < 0.001) had greater (i.e., worse gait performance) mean values of stride time (P = 0.006) compared to CHI. The participants with combined cognitive impairment had a greater CoV of stride time (i.e., worse gait performance) compared to CHI (P = 0.004) and to those with separate memory impairment (P = 0.037).
Table 1.
Comparisons of the participants’ characteristics separated into four groups based on cognitive status (n = 1458)
| Total population (n = 1458) | CHI (n = 941) | Individuals with | P valuea | |||||||||
|---|---|---|---|---|---|---|---|---|---|---|---|---|
| MI (n = 244) | EFI (n = 189) | MI and EFI (n = 84) | Overall | CHI vs. MI | CHI vs. EFI | CHI vs. MI and EFI | MI vs. EFI | MI vs. MI and EFI | EI vs MI and EFI | |||
| Age (years), mean ± SD | 70.6 ± 4.9 | 70.1 ± 4.5 | 70.8 ± 5.1 | 71.9 ± 5.6 | 72.6 ± 5.9 | < 0.001 | 0.308 | < 0.001 | <0.001 | 0.118 | 0.022 | 1.000 |
| Female gender, n (%) | 717 (49.2) | 485 (51.5) | 103 (42.2) | 92 (48.7) | 37 (44.0) | 0.052 | – | – | – | – | – | – |
| Number of drugs taken per day, mean ± SD | 2.9 ± 2.5 | 2.8 ± 2.5 | 3.0 ± 2.6 | 3.2 ± 2.6 | 3.5 ± 2.6 | 0.020 | 0.927 | 0.178 | 0.109 | 1.000 | 1.000 | 1.000 |
| Use of psychoactive drugsb, n (%) | 268 (18.4) | 153 (16.3) | 57 (23.4) | 39 (20.6) | 19 (22.6) | 0.045 | 0.019 | 0.064 | 0.293 | 0.344 | 0.929 | 0.682 |
| Depression symptomsc, n (%) | 345 (23.7) | 190 (20.2) | 71 (29.1) | 52 (27.5) | 32 (38.1) | <0.001 | <0.001 | 0.002 | <0.001 | 0.679 | 0.125 | 0.080 |
| Body mass index (kg/m2), mean ± SD | 26.3 ± 4.2 | 26.1 ± 4.1 | 26.8 ± 4.4 | 26.6 ± 4.2 | 27.3 ± 5.2 | 0.008 | 0.080 | 0.831 | 0.063 | 1.000 | 1.000 | 1.000 |
| Handgrip strengthe (N m−2), mean ± SD | 30.9 ± 10.5 | 31.1 ± 10.6 | 32.0 ± 10.8 | 29.8 ± 9.8 | 27.8 ± 9.9 | 0.006 | 1.000 | 0.678 | 0.034 | 0.169 | 0.009 | 0.893 |
| Lower-limb proprioceptione (/8), mean ± SD | 6.3 ± 1.7 | 6.4 ± 1.7 | 6.1 ± 1.7 | 6.2 ± 1.7 | 5.7 ± 1.9 | 0.001 | 0.116 | 1.000 | 0.003 | 1.000 | 0.401 | 0.131 |
| Distance visual acuityf (/10), mean ± SD | 7.1 ± 2.1 | 7.3 ± 2.1 | 7.1 ± 2.0 | 6.6 ± 2.2 | 6.0 ± 2.3 | <0.001 | 1.000 | 0.001 | <0.001 | 0.078 | <0.001 | 0.083 |
| Fear of fallingg, n (%) | 303 (20.8) | 180 (19.1) | 56 (23.0) | 41 (21.7) | 26 (31.0) | 0.054 | – | – | – | – | – | – |
| History of falls in the past year, n (%) | 460 (31.6) | 290 (30.8) | 80 (32.8) | 57 (30.2) | 33 (39.3) | 0.407 | – | – | – | – | – | – |
| Stride time | ||||||||||||
| Mean value (ms), mean ± SD | 1152.6 ± 134.5 | 1140.9 ± 127.7 | 1172.7 ± 136.5 | 1161.7 ± 140.8 | 1205.0 ± 165.6 | <0.001 | 0.006 | 0.301 | <0.001 | 1.000 | 0.333 | 0.080 |
| Coefficient of variation (%), mean ± SD | 2.1 ± 1.4 | 2.0 ± 1.4 | 2.1 ± 1.4 | 2.2 ± 1.5 | 2.6 ± 1.8 | 0.004 | 1.000 | 0.450 | 0.004 | 1.000 | 0.037 | 0.359 |
Significant P value (i.e., P < 0.05) indicated in italics
CHI cognitive healthy individuals, MI episodic memory impairment (i.e., short mini-mental status examination score <6/6), EFI executive function impairment (i.e., clock-drawing test abnormal considered if any error was made in the drawing of the circle or the position of the numbers and/or the hands of the clock)
aComparison based on one-way ANOVA with Bonferroni corrections or chi-square test, as appropriate
bUse of benzodiazepines or antidepressants, neuroleptics
cScore on 4-item geriatric depression scale ≥1
dMean value of the highest value of maximal isometric voluntary contraction strength measured with computerized dynamometers expressed in Newton per square meter
eMean value of left and right side and based on graduated diapason placed on the lower-limb
fBinocular visual acuity at a distance of 5 m with a Snellen letter test chart
gAnswer yes to the question “are you afraid of falling?”
Table 2 presents the linear regressions investigating the association between cognitive status (i.e., no cognitive impairment, episodic memory, EF, and combination of these both cognitive functions) and both stride time parameters (i.e., mean value and CoV) adjusted on participants’ characteristics. Cognitive status was significantly associated with the mean value of stride time, worse performance being associated with an increased mean value. First, CHI had a smaller value compared to individuals with at least one cognitive impairment (P < 0.020). Second, participants with cognitive impairment had a greater mean value compared to CHI, except those with EF impairment while adjusting on all participants’ characteristics (P = 0.058, model 3). Cognitive status was also associated with CoV of stride time in most of the cases (P < 0.044) in the univariate (model 1) and the model adjusted on age and gender (model 2). CHI had a smaller CoV of stride time compared to individuals with at least one cognitive impairment (P < 0.044), except while adjusting on all participants’ characteristics (P = 0.179, model 3). Participants with cognitive impairment had a greater CoV of stride time compared to CHI, except those with memory impairment while adjusting on age and gender (P = 0.066, model 2) and on all participants’ characteristics (P = 0.207, model 3), and those with EF impairment while adjusting on all participants’ characteristics (P = 0.059, model 3). As shown in Fig. 1, among participants with combined cognitive impairments, the highest and significant effect size was reported for the mean value and the CoV of stride time (effect size = 0.49 [95 % confidence interval (CI) 0.27; 0.71], and effect size=0.40 [95 % CI 0.18;0.62]). Effect sizes with combined cognitive impairments were greater than the sum of the effect size of episodic memory impairment and EF impairment considered separately.
Table 2.
Linear regression models showing the association between stride time parameters (dependent variable) and cognitive impairment (independent variable) adjusted on participants’ characteristics (n = 1458)
| Cognitive status of participants (separate model for each group) | Model 1 | Model 2 | Model 3 | ||||||
|---|---|---|---|---|---|---|---|---|---|
| ß | 95 % CI | P value | ß | 95 % CI | P value | ß | 95 % CI | P value | |
| Mean value of stride time | |||||||||
| No cognitive impairmenta | −0.033 | [−0.047;−0.019] | <0.001 | −0.023 | [−0.037;−0.010] | 0.001 | −0.017 | [−0.030;−0.003] | 0.016 |
| Cognitive impairment in | |||||||||
| Episodic memoryb | 0.040 | [0.023;0.057] | <0.001 | 0.028 | [0.013;0.044] | <0.001 | 0.021 | [0.005;0.036] | 0.010 |
| Executive functionsc | 0.034 | [0.016;0.052] | <0.001 | 0.025 | [0.008;0.042] | 0.004 | 0.016 | [−0.001;0.033] | 0.058 |
| Episodic memory and executive functions d | 0.064 | [0.035;0.093] | <0.001 | 0.050 | [0.022;0.077] | <0.001 | 0.034 | [0.006;0.061] | 0.016 |
| Coefficient of variation of stride time | |||||||||
| No cognitive impairmenta | −0.193 | [−0.347;−0.039] | 0.014 | −0.160 | [−0.314;−0.005] | 0.043 | −0.107 | [−0.263;0.049] | 0.179 |
| Cognitive impairment in | |||||||||
| Episodic memoryb | 0.187 | [0.008;0.366] | 0.041 | 0.168 | [−0.011;0.348] | 0.066 | 0.117 | [−0.065;0.298] | 0.207 |
| Executive functionsc | 0.312 | [0.119;0.505] | 0.002 | 0.259 | [0.064;0.454] | 0.009 | 0.191 | [−0.006;0.389] | 0.059 |
| Episodic memory and executive functionsd | 0.556 | [0.240;0.873] | 0.001 | 0.505 | [0.186;0.824] | 0.002 | 0.396 | [0.070;0.722] | 0.017 |
Model 1, univariate model. Model 2, adjusted for age and gender. Model 3, fully adjusted model (i.e., age, gender, number of drugs used per day, use of psychoactive drugs, depression symptoms, BMI, lower-limb proprioception, distance vision score, and handgrip strength). Separate models were used for each cognitive condition (i.e., no cognitive impairment, cognitive impairment in memory, cognitive impairment in executive functions, cognitive impairment in both memory and executive functions). Thus, for the condition “no cognitive impairment,” the reference group is participants with at least one cognitive impairment, whereas for the “conditions with cognitive impairment,” the reference group is the participants with no cognitive impairment. Significant P value (i.e., P < 0.05) indicated in italics
CI confidence interval, β coefficient of regression beta corresponding to increase or decrease in mean value or coefficient of variation of stride time
aShort mini-mental status examination and clock-drawing scores normal
bShort mini-mental status examination score <6/6
cClock drawing score abnormal
dShort mini-mental status examination and clock-drawing scores abnormal
Fig. 1.
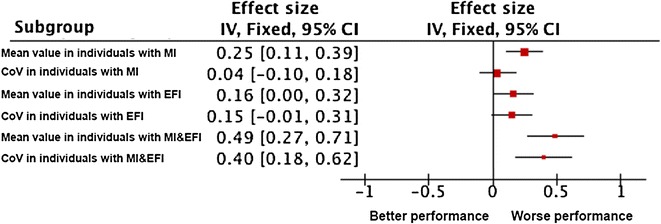
Effect size of the association of cognitive status (i.e., episodic memory impairment, executive function impairment, and memory plus executive impairment) with stride time parameters (i.e., mean value and coefficient of variation) (n = 1458). Effect size was calculated from the mean value and standard deviation of each stride time parameter (i.e., mean value or CoV) in participants with cognitive impairments (i.e.; separate episodic memory impairment, separate executive function impairment, or combined episodic memory and executive function impairments). An effect size calculator worksheet was used to derive effect size and standard error from mean and standard deviation and size of each group (Coe’s Calculator retrieved 25 March 2015 from http://www.cemcentre.org/evidence-basededucation/effect-size-calculator). MI episodic memory impairment (i.e., short mini-mental status examination score <6/6), EFI executive function impairment (i.e., abnormal clock-drawing test abnormal considered if any error was made in the drawing of the circle or the position of the numbers and/or the hands of the clock), CoV coefficient of variation. The red square area is proportional to the number of individuals of each group, and horizontal lines correspond to the 95 % confidence interval. The vertical line corresponds to no difference compared to individuals with no cognitive impairment. Worse performance corresponds to an increase in value of stride parameters compared to individuals with no cognitive impairment
Discussion
The findings showed that non-demented older adults with separate and combined episodic memory and EF impairments had greater (i.e., worse gait performance) mean value and CoV of stride time compared to CHI. Impairments in these both stride time parameters depended on the separate domain of the cognitive impairment and their combination. Episodic memory impairment was mainly associated with increased mean value of stride time, whereas EF impairment was mainly associated with increased CoV of stride time. The effects of the combined cognitive impairments on stride time values were greater than the sum of the separate effects of each cognitive impairment, especially for the CoV of stride time, confirming a complex interplay between episodic memory and executive impairments on gait variability going beyond a simple additive effect.
Mean value and CoV of stride time have been separately associated with cognitive performances in non-demented older adults (Hausdorff et al. 2005; Beauchet et al. 2012, 2014a, b). Episodic memory and EF are two cognitive domains associated with stride time values, impaired cognitive performance being associated with greater mean value and CoV of stride time (Hausdorff et al. 2005; Beauchet et al. 2012, 2014a, b). The reported associations here, between EF impairment and the CoV of stride time and between episodic memory impairment and the mean value of stride time, confirm the findings previously reported in healthy older adults (Beauchet et al. 2012, 2014a, b), as well as in older adults with MCI and dementia (Montero-Odasso et al. 2012; Scherder et al. 2007; Allali et al. 2010; Hausdorff 2005; Sheridan et al. 2003). In neurodegenerative disease characterized by EF impairment such as Alzheimer’s disease (AD) (Sheridan et al. 2003; Allali et al. 2008), the behavioral variant of frontotemporal dementia (Allali et al. 2010), Parkinson’s disease (Yogev et al. 2005), MCI (Verghese et al. 2008) or mild parkinsonian signs (Allali et al. 2014a), the association with EF impairment was stronger for the CoV than for the mean value of stride time. Interestingly, we reported a similar pattern of results in the present sample of non-demented older adults, EF impairment being specifically associated with increased CoV of stride time. This association could be interpreted as another example of the vulnerability of the executive system during normal aging, which affects in turn gait variability (Burke and Barnes 2006).
Regarding the reported association between mean value of stride time and episodic memory, a previous report linked the rhythm component of gait with future decline in memory (Verghese et al. 2007). The mechanism of this association can be found in neuroimaging studies underlining the role of the hippocampus—a key brain region involved in memory processing—on gait control during normal aging (Seidler et al. 2010). Hippocampal neurochemistry as well as hippocampal volumes or hippocampal grey matter integrity were independently associated with gait control during normal aging (Zimmerman et al. 2009; Rosso et al. 2014). This hippocampal involvement was also confirmed by functional MRI protocol using mental imagery of gait to assess the age-related neural correlates of gait control (Zwergal et al. 2012; Allali et al. 2014b).
The combined effects of episodic memory and EF impairments on gait parameters exceed the expected sum of both separate effects and suggest a deleterious complex interplay going beyond a simple additive effect on gait control. Such an effect could be interpreted by the findings of functional neuroimaging studies. First, a recent study examined changes in whole-brain glucose metabolism using FDG-PET during rest and unaccustomed treadmill walking in healthy older adults, classified as either low or high step-length variability walkers (Shimada et al. 2013). This study showed that individuals with high step-length variability showed relative deactivations in the supplementary motor areas and dorsolateral prefrontal cortex compared to rest and that individuals with low step-length variability exhibited greater relative activations in the primary motor area during treadmill walking compared to the high step-length variability group. In addition, the high step-length variability group showed greater relative deactivations in the temporal lobe, especially in the hippocampus, during treadmill walking compared with the low step-length variability group. Second, mental imagery of gait was used to assess the neural correlates of gait control in healthy older adults (Zwergal et al. 2012; Allali et al. 2014b). Compared to younger adults, older adults activates more diffused brain networks involving cortical regions (prefrontal cortex, hippocampus) as well as subcortical structures (brainstem and cerebellum) in order to perform the same walking task than the young adults. So, when non-demented older adults present deficits in different cognitive domains (e.g., executive functions and memory) resulting from a dysfunction of a proportional numbers of networks in relationship with the affected domain, the consequence of these multiple cognitive deficits on gait control may exceed the simple sum of each separate deficit and induces a complex interplay going beyond a simple additive effect. A direct consequence of this effect can be observed in clinical practice in older adults with AD: at disease onset, subtle gait disorders can be identified only with instrumented devices, whereas during the evolution of the disease, gait disorders will become more obvious for the clinician eyes (Beauchet et al. 2008). Another clinical example of this effect is illustrated by patients with Parkinson’s disease and freezing of gait: previous reports suggest that this specific phenotype of Parkinson’s disease presents a more severe cognitive and motor impairment than suspected in Parkinson’s disease in general at the same stage of the disease (Ricciardi et al. 2014). Thus, this effect of different cognitive impairments on gait underlies the complexity of the gait control and contributes to explain the devastating consequences of advanced neurodegenerative disease on gait.
Testing the complex interplay of subdomains of cognitive impairments on gait control on such a large cohort of older adults without dementia constitutes the main strength of this study. However, the use of an instrumented walkway represents a limitation and prevents the translation of these findings into clinical practice. The unavailability of a detailed neuropsychological assessment, including domain-specific cognitive tests other than memory or EF, constitutes another limitation. A further study needs to examine in detail the association between cognitive domains and stride time, including a comprehensive neuropsychological battery. Finally, the cross-sectional design of this study prevents any causal inferences.
Conclusions
Separate episodic memory and EF impairments were associated with greater (i.e., worse gait performance) mean value and CoV of stride time. Combined episodic memory and EF impairments exceeded the sum of the effects of separate cognitive impairments on gait parameters and confirms a complex interplay going beyond a simple additive effect. These findings underscore that clinicians should be more attentive to gait disorders in non-demented older adults with impairments affecting multiple cognitive domains that could reflect an early sign of neurodegenerative diseases like AD.
Acknowledgments
We are grateful to the participants for their cooperation.
Author’s Contributions
Prof. O. Beauchet, Dr. C.P. Launay, Prof. B. Fantino, Dr. C. Annweiler, and Dr. G. Allali formulated the research question and designed the study. Prof. O. Beauchet and Prof. B. Fantino carried out data collection. Prof. O. Beauchet and Dr. G. Allali were responsible for carrying out the statistical analysis. Prof. O. Beauchet wrote the paper, and all authors contributed to its revision.
Conflict of interests
The authors declare that they have no competing interests.
Funding
Gilles Allali is supported by a grant from the Geneva University Hospitals and the Resnick Gerontology Center, Albert Einstein College of Medicine, Yeshiva University.
References
- Allali G, Dubois B, Assal F, Lallart E, de Souza LC, Bertoux M, Annweiler C, Herrmann FR, Levy R, Beauchet O. Frontotemporal dementia: pathology of gait? Mov Disord. 2010;25:723–729. doi: 10.1002/mds.22927. [DOI] [PubMed] [Google Scholar]
- Allali G, Assal F, Kressig RW, Dubost V, Herrmann FR, Beauchet O. Impact of impaired executive function on gait stability. Dement Geriatr Cogn Disord. 2008;26:364–369. doi: 10.1159/000162358. [DOI] [PubMed] [Google Scholar]
- Allali G, Verghese J, Mahoney JR. Contributions of mild Parkinsonian signs to gait performance in the elderly. Age (Dordr) 2014;36:9678. doi: 10.1007/s11357-014-9678-4. [DOI] [PMC free article] [PubMed] [Google Scholar]
- Allali G, van der Meulen M, Beauchet O, Rieger SW, Vuilleumier P, Assal F. The neural basis of age-related changes in motor imagery of gait: an FMRI study. J Gerontol A Biol Sci Med Sci. 2014;69:1389–1398. doi: 10.1093/gerona/glt207. [DOI] [PubMed] [Google Scholar]
- Annweiler C, Beauchet O, Bartha R, Wells JL, Borrie MJ, Hachinski V, Montero-Odasso M. Motor cortex and gait in mild cognitive impairment: a magnetic resonance spectroscopy and volumetric imaging study. Brain. 2013;136:859–871. doi: 10.1093/brain/aws373. [DOI] [PubMed] [Google Scholar]
- Annweiler C, Montero-Odasso M, Bartha R, Drozd J, Hachinski V, Beauchet O. Association between gait variability and brain ventricle attributes: a brain mapping study. Exp Gerontol. 2014;57:256–263. doi: 10.1016/j.exger.2014.06.015. [DOI] [PubMed] [Google Scholar]
- Ayoubi F, Launay CP, Annweiler C, Beauchet O. Fear of falling and gait variability in older adults: a systematic review and meta-analysis. J Am Med Dir Assoc. 2014;16:14–19. doi: 10.1016/j.jamda.2014.06.020. [DOI] [PubMed] [Google Scholar]
- Beauchet O, Annweiler C, Montero-Odasso M, Fantino B, Herrmann FR, Allali G. Gait control: a specific subdomain of executive function? J Neuroeng Rehabil. 2012;9:12. doi: 10.1186/1743-0003-9-12. [DOI] [PMC free article] [PubMed] [Google Scholar]
- Beauchet O, Allali G, Montero-Odasso M, Sejdić E, Fantino B, Annweiler C. Motor phenotype of decline in cognitive performance among community dwellers without dementia: population-based study and meta-analysis. PLoS One. 2014;9:e99318. doi: 10.1371/journal.pone.0099318. [DOI] [PMC free article] [PubMed] [Google Scholar]
- Beauchet O, Annweiler C, Verghese J, Fantino B, Herrmann FR, Allali G. Biology of gait control: vitamin D involvement. Neurology. 2011;76:1617–1622. doi: 10.1212/WNL.0b013e318219fb08. [DOI] [PMC free article] [PubMed] [Google Scholar]
- Beauchet O, Annweiler C, Celle S, Bartha R, Barthélémy JC, Roche F. Higher gait variability is associated with decreased parietal gray matter volume among healthy older adults. Brain Topogr. 2014;27:293–295. doi: 10.1007/s10548-013-0293-y. [DOI] [PubMed] [Google Scholar]
- Beauchet O, Dubost V, Revel Delhom C, Berrut G, Belmin J, French Society of Geriatrics and Gerontology How to manage recurrent falls in clinical practice: guidelines of the French Society of Geriatrics and Gerontology. J Nutr Health Aging. 2011;15:79–84. doi: 10.1007/s12603-011-0016-6. [DOI] [PubMed] [Google Scholar]
- Beauchet O, Allali G, Berrut G, Hommet C, Dubost V, Assal F. Gait analysis in demented subjects: interests and perspectives. Neuropsychiatr Dis Treat. 2008;4:155–160. doi: 10.2147/NDT.S2070. [DOI] [PMC free article] [PubMed] [Google Scholar]
- Ble A, Volpato S, Zuliani G, Guralnik JM, Bandinelli S, Lauretani F, Bartali B, Maraldi C, Fellin R, Ferrucci L. Executive function correlates with walking speed in older persons: the InCHIANTI study. J Am Geriatr Soc. 2005;53:410–415. doi: 10.1111/j.1532-5415.2005.53157.x. [DOI] [PubMed] [Google Scholar]
- Burke SN, Barnes CA. Neural plasticity in the ageing brain. Nat Rev Neurosci. 2006;7:30–40. doi: 10.1038/nrn1809. [DOI] [PubMed] [Google Scholar]
- Haubois G, de Decker L, Annweiler C, Launay C, Allali G, Herrmann FR, Beauchet O. Derivation and validation of a short form of the mini-mental state examination for the screening of dementia in older adults with a memory complaint. Eur J Neurol. 2013;20:588–590. doi: 10.1111/j.1468-1331.2012.03830.x. [DOI] [PubMed] [Google Scholar]
- Harada CN, Natelson Love MC, Triebel KL. Normal cognitive aging. Clin Geriatr Med. 2013;29:737–752. doi: 10.1016/j.cger.2013.07.002. [DOI] [PMC free article] [PubMed] [Google Scholar]
- Hausdorff JM, Yogev G, Springer S, Simon ES, Giladi N. Walking is more like catching than tapping: gait in the elderly as a complex cognitive task. Exp Brain Res. 2005;164:541–548. doi: 10.1007/s00221-005-2280-3. [DOI] [PubMed] [Google Scholar]
- Hausdorff JM. Gait variability: methods, modeling and meaning. J Neuroeng Rehabil. 2005;2:19. doi: 10.1186/1743-0003-2-19. [DOI] [PMC free article] [PubMed] [Google Scholar]
- Kressig RW, Beauchet O. European GAITRite Network Group. Guidelines for clinical applications of spatio-temporal gait analysis in older adults. Aging Clin Exp Res. 2006;18:174–176. doi: 10.1007/BF03327437. [DOI] [PubMed] [Google Scholar]
- Lin JS, O’Connor E, Rossom RC, Perdue LA, Eckstrom E. Screening for cognitive impairment in older adults: a systematic review for the U.S. Preventive Services Task Force. Ann Intern Med. 2013;159:601–612. doi: 10.7326/0003-4819-159-9-201311050-00730. [DOI] [PubMed] [Google Scholar]
- Lord SR, Ward JA, Williams P, Anstey KJ. Physiological factors associated with falls in older community-dwelling women. J Am Geriatr Soc. 1994;42:1110–1117. doi: 10.1111/j.1532-5415.1994.tb06218.x. [DOI] [PubMed] [Google Scholar]
- Montero-Odasso M, Verghese J, Beauchet O, Hausdorff JM. Gait and cognition: a complementary approach to understanding brain function and the risk of falling. J Am Geriatr Soc. 2012;60:2127–2136. doi: 10.1111/j.1532-5415.2012.04180.x. [DOI] [PMC free article] [PubMed] [Google Scholar]
- Ricciardi L, Bloem BR, Snijders AH, Daniele A, Quaranta D, Bentivoglio AR, Fasano A. Freezing of gait in Parkinson’s disease: the paradoxical interplay between gait and cognition. Parkinsonism Relat Disord. 2014;20:824–829. doi: 10.1016/j.parkreldis.2014.04.009. [DOI] [PubMed] [Google Scholar]
- Rossat A, Fantino B, Nitenberg C, Annweiler C, Poujol L, Herrmann FR, Beauchet O. Risk factors for falling in community-dwelling older adults: which of them are associated with the recurrence of falls? J Nutr Health Aging. 2010;14:787–791. doi: 10.1007/s12603-010-0089-7. [DOI] [PubMed] [Google Scholar]
- Rosso AL, Olson Hunt MJ, Yang M, Brach JS, Harris TB, Newman AB, Satterfield S, Studenski SA, Yaffe K, Aizenstein HJ, Rosano C, Health ABC study Higher step length variability indicates lower gray matter integrity of selected regions in older adults. Gait Posture. 2014;40:225–230. doi: 10.1016/j.gaitpost.2014.03.192. [DOI] [PMC free article] [PubMed] [Google Scholar]
- Scherder E, Eggermont L, Swaab D, van Heuvelen M, Kamsma Y, de Greef M, van Wijck R, Mulder T. Gait in ageing and associated dementias: its relationship with cognition. Neurosci Biobehav Rev. 2007;31:485–497. doi: 10.1016/j.neubiorev.2006.11.007. [DOI] [PubMed] [Google Scholar]
- Seidler RD, Bernard JA, Burutolu TB, Fling BW, Gordon MT, Gwin JT, Kwak Y, Lipps DB. Motor control and aging: links to age-related brain structural, functional, and biochemical effects. Neurosci Biobehav Rev. 2010;34:721–733. doi: 10.1016/j.neubiorev.2009.10.005. [DOI] [PMC free article] [PubMed] [Google Scholar]
- Shah A, Herbert R, Lewis S, Mahendran R, Platt J, Bhattacharyya B. Screening for depression among acutely ill geriatric in patients with a short geriatric depression scale. Age Ageing. 1997;26:217–221. doi: 10.1093/ageing/26.3.217. [DOI] [PubMed] [Google Scholar]
- Sheridan PL, Solomont J, Kowall N, Hausdorff JM. Influence of executive function on locomotor function: divided attention increases gait variability in Alzheimer’s disease. J Am Geriatr Soc. 2003;51:1633–1637. doi: 10.1046/j.1532-5415.2003.51516.x. [DOI] [PubMed] [Google Scholar]
- Shimada H, Ishii K, Ishiwata K, Oda K, Suzukawa M, Makizako H, Doi T, Suzuki T. Gait adaptability and brain activity during unaccustomed treadmill walking in healthy elderly females. Gait Posture. 2013;38:203–208. doi: 10.1016/j.gaitpost.2012.11.008. [DOI] [PubMed] [Google Scholar]
- Sunderland T, Hill JL, Mellow AM, Lawlor BA, Gundersheimer J, Newhouse PA, Grafman JH. Clock drawing in Alzheimer’s disease. A novel measure of dementia severity. J Am Geriatr Soc. 1989;37:725–729. doi: 10.1111/j.1532-5415.1989.tb02233.x. [DOI] [PubMed] [Google Scholar]
- Verghese J, Wang C, Lipton RB, Holtzer R, Xue X. Quantitative gait dysfunction and risk of cognitive decline and dementia. J Neurol Neurosurg Psychiatry. 2007;78:929–935. doi: 10.1136/jnnp.2006.106914. [DOI] [PMC free article] [PubMed] [Google Scholar]
- Watson NL, Rosano C, Boudreau RM, Simonsick EM, Ferrucci L, Sutton-Tyrrell K, Hardy SE, Atkinson HH, Yaffe K, Satterfield S, Harris TB, Newman AB, Health ABC Study Executive function, memory, and gait speed decline in well-functioning older adults. J Gerontol A Biol Sci Med Sci. 2010;65:1093–1100. doi: 10.1093/gerona/glq111. [DOI] [PMC free article] [PubMed] [Google Scholar]
- Verghese J, Robbins M, Holtzer R, Zimmerman M, Wang C, Xue X, Lipton RB. Gait dysfunction in mild cognitive impairment syndromes. J Am Geriatr Soc. 2008;56:1244–1251. doi: 10.1111/j.1532-5415.2008.01758.x. [DOI] [PMC free article] [PubMed] [Google Scholar]
- Yogev G, Giladi N, Peretz C, Springer S, Simon ES, Hausdorff JM. Dual tasking, gait rhythmicity, and Parkinson’s disease: which aspects of gait are attention demanding? Eur J Neurosci. 2005;22:1248–1256. doi: 10.1111/j.1460-9568.2005.04298.x. [DOI] [PubMed] [Google Scholar]
- Zimmerman ME, Lipton RB, Pan JW, Hetherington HP, Verghese J. MRI- and MRS-derived hippocampal correlates of quantitative locomotor function in older adults. Brain Res. 2009;1291:73–81. doi: 10.1016/j.brainres.2009.07.043. [DOI] [PMC free article] [PubMed] [Google Scholar]
- Zwergal A, Linn J, Xiong G, Brandt T, Strupp M, Jahn K. Aging of human supraspinal locomotor and postural control in fMRI. Neurobiol Aging. 2012;33:1073–1084. doi: 10.1016/j.neurobiolaging.2010.09.022. [DOI] [PubMed] [Google Scholar]