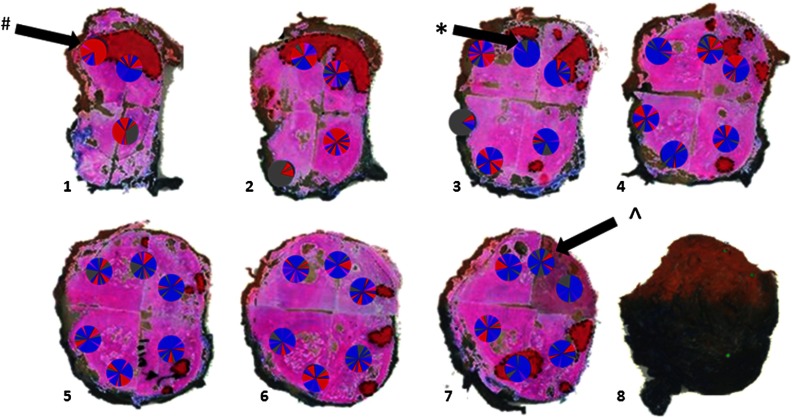
Fig. 7.
Histopathological evaluation. The prostate was sliced from base (slice 1), to apex (slice 8), and all slices were positioned with the same side up. The pathologist indicated areas of tumor on the slides, as marked in red. The attenuation information from these matched B-scans were also plotted in the picture of the prostate slices (1 to 8). # corresponds to Fig. 6(b), * to Fig. 6(c), and ^ to Fig. 6(d).

