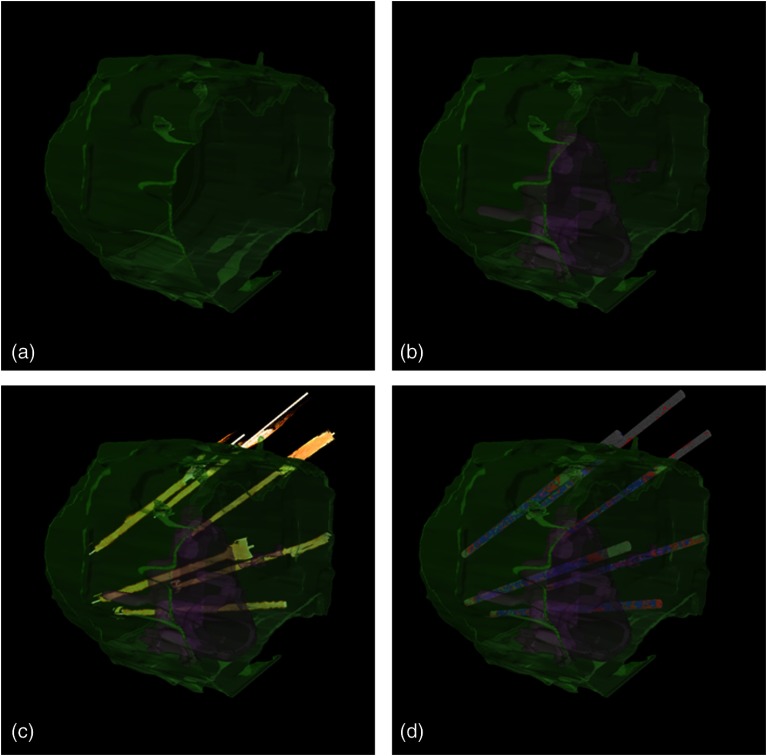
Fig. 8.
3-D correlation to histopathology. (a) Using AMIRA™, we reconstructed the prostate contour (green) by stacking the slices from Fig. 6 in 3-D. (b) Because the pathologist outlined the tumor contours on the slides, we were able to reconstruct the tumors in 3-D. By plotting the (c) St. Jude OCT measurements and (d) attenuation maps in these reconstructed contours, based on the IV catheters that were visible in the slices, we could estimate which B-scans corresponded to the sampled areas in the prostate slices. The attenuation maps of these corresponding B-scans are overlaid in Fig. 7.

