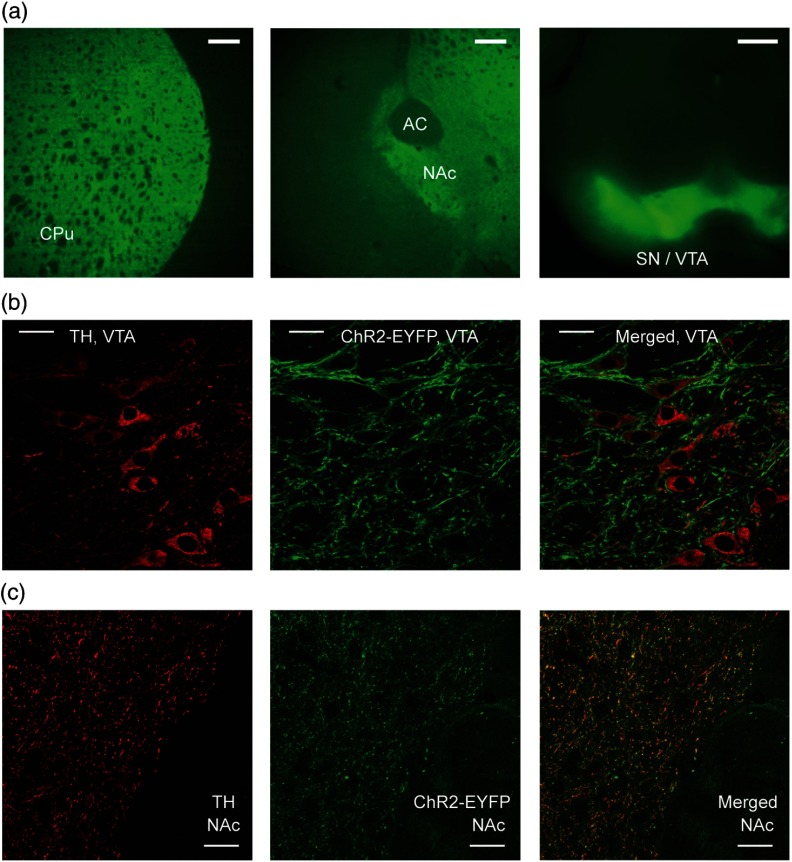
Fig. 1.
ChR2-EYFP expression in transgenic mouse brain slices. (a) Fluorescent microscope images (excitation wavelength for YFP: 490 nm) show existence of YFP fluorescence in caudate putamen (left) and nucleus accumbens (NAc) (middle; AC: anterior commissure) in forebrain coronal slices ( AP; scale bars are 0.2 mm). Expression is also seen in midbrain coronal slices of SN/VTA (right; AP; scale bar is 0.5 mm). (b) Histological analysis with tyrosine hydroxylase (TH) immunostaining in the VTA ( AP) where DA cell bodies can be seen. TH is shown in red (left); YFP fluorescence is in green (middle); merged image is on the right. Scale bars indicate . (c) Same histological images in the NAc ( AP) show dopaminergic neuron projections (but not cell bodies). Scale bars indicate .

