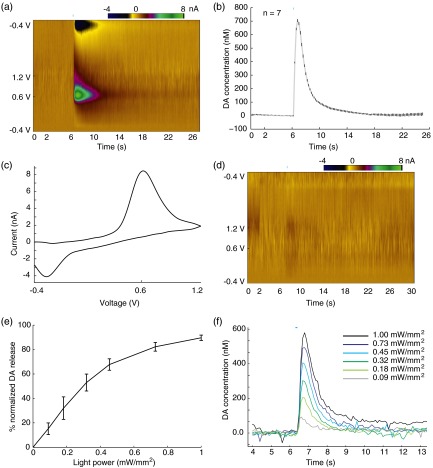
Fig. 2.
Optogenetically induced dopamine (DA) release in NAc and the modulation effect of light power. (a) Recorded standard fast-scan cyclic voltammetry (FSCV) two-dimensional (2-D) color plot under a 25-ms square pulse light stimulation at . axis shows background-subtracted voltammetry current in pseudocolor. (b) Mean DA concentration trace under the same stimulation parameter with small vertical bars represent ( recordings in the same slice). (c) Background subtracted cyclic voltammogram at optical DA release peak; oxidation current is seen at 0.6 V and reduction current around . (d) One control experiment where the electrode is not inserted in the brain slices but under the same light stimulation parameters shows no DA signals and minimal light artifact. (e) Optically induced DA peak level as a function of light power, across three animals. ( recordings in total; recordings are separated by 5 to 10 min to allow DA recovery. Vertical bars represent ±SEM. Pulse width is fixed at 100 ms.) (f) Stacked DA concentration traces under the six different light power in one of the animals.

