
Fig. 3.
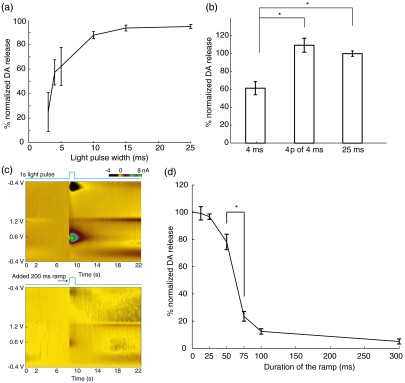
The effects of light pulse width and waveform shape on the concentration of DA release. (a) Optically induced DA peak level as a function of light pulse width across four animals ( recordings in total; recordings are separated by 5 to 10 min to allow DA recovery. Vertical bars represent . Light power is fixed at ). (b) The induced DA release levels from light stimulations of a 4-ms pulse, four pulses of 4 ms (25 Hz), and a 25-ms pulse; , 10, 22 recordings respectively, across three animals. DA level evoked by the 4-ms pulse is different than the other two cases (one-way ANOVA and multiple comparison test, ; concentration normalized with respect to DA release of 25 ms pulses. (c) Standard FSCV 2-D color plots under a 1-s square pulse (top) versus a 200 ms ramp square pulse stimulation (bottom). axis shows background-subtracted voltammetry current in pseudo color; data is from single recordings. (d) DA peak level as a function of added ramp time to the 1-s square pulse. (In total recordings across four different animals. Recordings are separated by 5 to 10 min to allow DA recovery.) -axis is normalized with respect to the DA release induced by nonramp square pulses in each animal. Among adjacent ramp durations, DA peak level is significantly different between 50 and 75 ms ramp waveforms (one-way ANOVA and multiple comparison test, ).