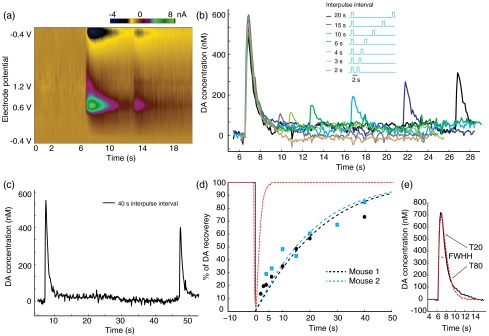
Fig. 4.

Recovery of releasable presynaptic DA pool and extracellular DA kinetic analyses. (a) FSCV color plot in one recording in which two light pulses of optogenetic stimulation were set 6 s apart. (b) Series of recorded DA concentration traces under two light pulses with interpulse intervals of 2, 3, 4, 6, 10, 15, 20 s. Stimulations were kept at power and 1 s in length; data is from a set of seven recordings in one of the animals from d. Recordings are separated by 5 to 10 minutes to allow DA recovery. (c) Same DA concentration trace at 40 s interpulse interval. (d) Recovered releasable presynaptic DA on second pulses as a function of interpulse interval in two adult transgenic mice (blue and black). Red line indicates the clearance of extracellular dopamine molecules (i.e., DA concentration recorded by FSCV). (e) In the uptake kinetic analysis, simulated (red) versus recorded (black) FSCV DA concentration signal. FWHH, , is shown.
