
FIGURE 2.
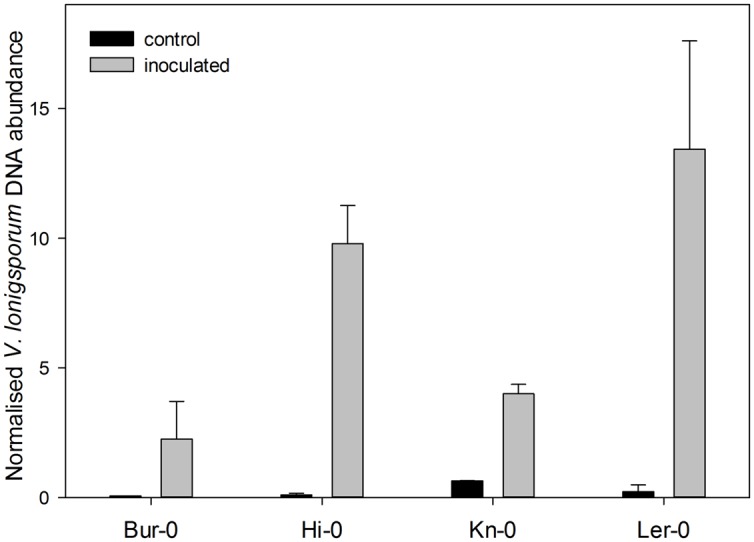
The relative abundance of V. longisporum DNA in the roots of the four A. thaliana accessions, estimated via a qPCR assay carried out 28 days after inoculation. Each data point represents the mean of three technical replicates and one representative experiment is shown. The error bars denote the SE associated with the mean.