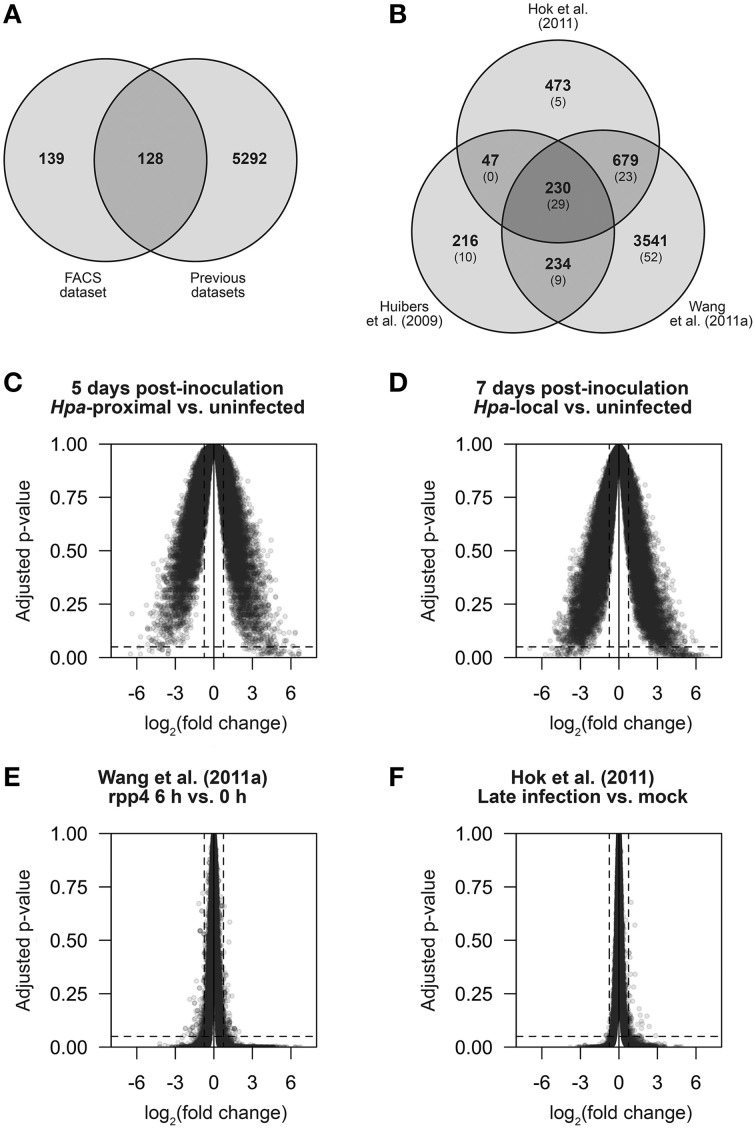
Figure 5.
The strength and specificity of Hpa-responsive gene detection in multiple datasets. In order to make direct comparisons, published data from Huibers et al. (2009), Wang et al. (2011a) and Hok et al. (2011) was processed in a similar manner to the data we present here. (A,B) Comparison of genes found to be differentially expressed (DE) using LIMMA. (A) Gene overlap of genes DE in our FACS dataset and genes found to be DE based on the previously published data. Of the 267 DE genes identified in our FACS dataset, 128 were previously detectable and 139 were novel. (B) Gene overlap between the three previously published datasets. In parentheses is the number of genes in each group that also overlap with our FACS dataset. (C–F) Average log2 fold change against Benjamini-Hochberg adjusted p-values for all measured transcripts (determined by LIMMA) in the comparisons: (C) Hpa-proximal vs. uninfected cells, 5 d.p.i. (D) Hpa-proximal vs. uninfected cells, 7 d.p.i. (E) Wang et al. (2011a) rpp4 Emwa1 6 d.p.i. vs. 0 d.p.i., (F) Hok et al. (2011) Emwa vs. Mock (late infection). Dotted lines represent the differential expression significance thresholds of absolute log2 fold change ≥0.75 and adjusted p ≤ 0.05.

