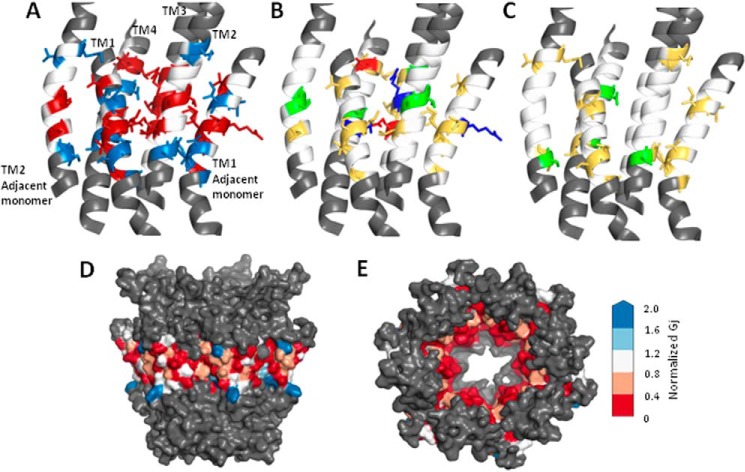
FIGURE 4.
Location of tryptophan-sensitive residues on a Cx32 model. A–C, schematic representation of four TM domains of one Cx32 subunit, including TM1 from the clockwise adjacent monomer and TM2 from the counterclockwise adjacent monomer. The N-terminal helix of the central monomer, which lies adjacent to TM1, has been omitted for clarity. The region assessed by tryptophan scanning is shown in white when no effect was produced and using an appropriate color for altered function (see below). Residues outside the targeted tryptophan scan are colored gray. A, location of all residues where tryptophan mutations produced altered function: abolished function (red side chains), significantly reduced function (blue side chains). B, location of all residues where tryptophan mutation produced nonfunctional channels with side chains colored by residue type: red, denoting negatively charged side chains; blue representing positively charged side chains; green representing polar side chains; and yellow representing hydrophobic (apolar or aromatic) side chains. C, reduced function sites with side chains colored by residue type, with red denoting negatively charged side chains, blue representing positively charged side chains, green representing polar side chains, and yellow representing hydrophobic (apolar or aromatic) side chains. D and E, results of tryptophan scanning displayed on a surface rendered Cx32 model with residues color-coded according to normalized conductance values as indicated in the spectrum on the right. Colors range from red (abolished function) and white (unaffected) to blue (increased function) D, side view of the hemichannel with cytoplasmic end at top. E, view through the pore from the cytoplasmic mouth, with the N terminus removed to show color coding of tryptophan-sensitive sites.

