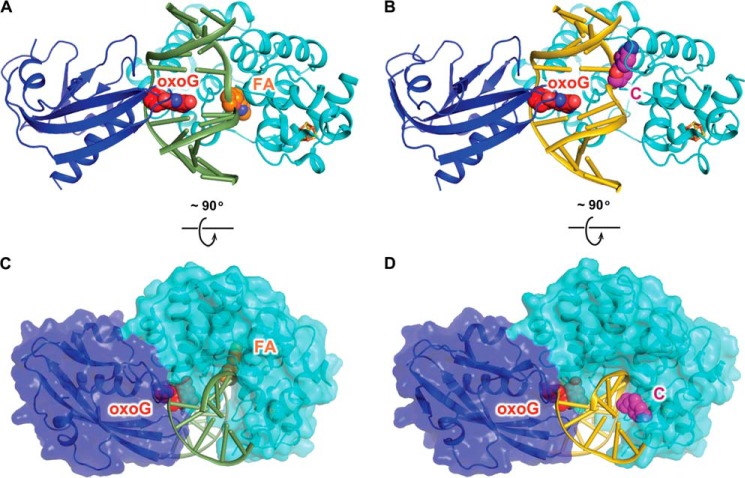
FIGURE 2.
Overall structures of the ASC and the FLRC. A, structure of the FLRC (PDB ID: 3G0Q) showing 2′-β-fluoroadenosine (FA) in the active site. The N-terminal catalytic domain of MutY is colored in cyan, the C-terminal MutT domain is in blue, and the iron-sulfur cluster is shown as orange (iron) and yellow (sulfur) sticks. The DNA backbone is colored green, and the oxoG and 2′-β-fluoroadenosine are shown as red (oxoG) and orange (A) spheres. B, structure of the ASC (present work) showing C in the exo-site. The color scheme is the same as in A except that DNA backbone is colored gold and C is in magenta. C and D, the bottom panel shows the FLRC (C) and the ASC (D) structures rotated 90 degrees from the top panel view, with the protein shown in surface representation.

