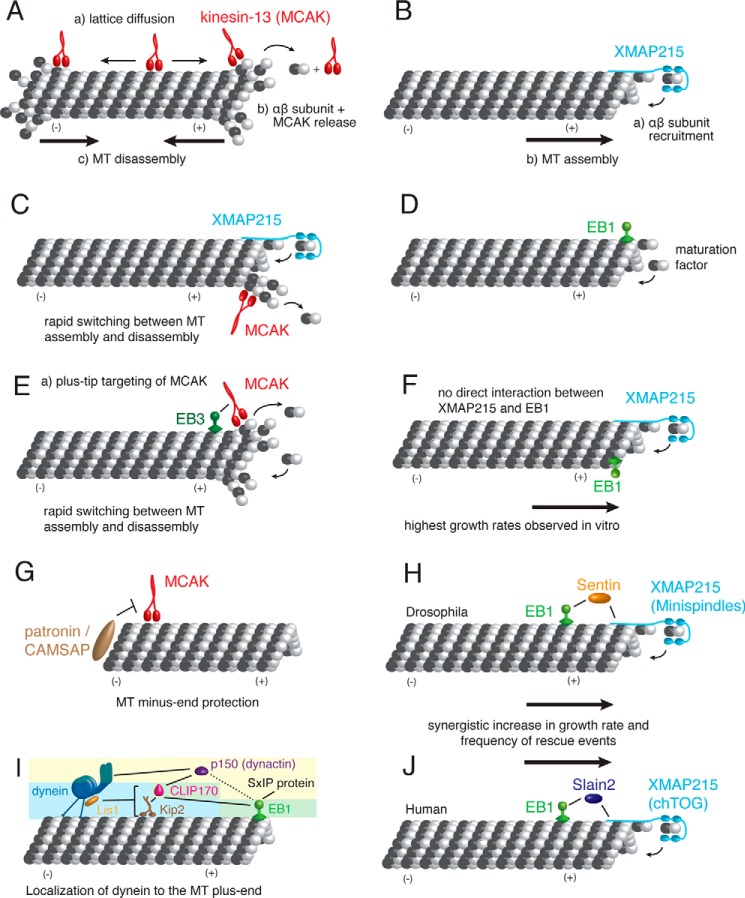
FIGURE 2.
In vitro reconstitutions of microtubules and more than one MAP. A, C, E, and G depict in vitro reconstitutions with the MT depolymerase MCAK. B, F, H, and J display in vitro studies with the MT polymerase XMAP215. D, E, F, H, I, and J show how EBs modulate MT dynamics by recruiting factors to the MT plus-end. Each of the in vitro studies (A–J) are discussed in the main text.

