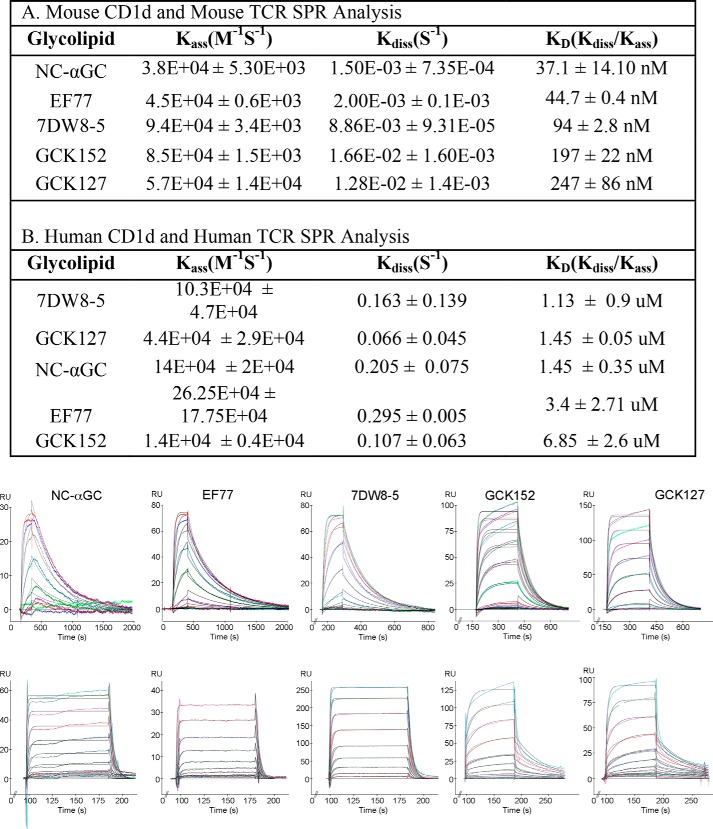
FIGURE 2.
Real time TCR binding kinetics. Binding of refolded mouse Vα14Vβ8.2 TCR (A) or human Vα24Vβ11 TCR (B) to the indicated glycolipids presented by mouse and human CD1d, respectively. One representative sensorgram is depicted at the bottom showing the binding response of increasing concentrations of TCR (colored curves) and the calculated fit (black curves).

