
FIGURE 2.
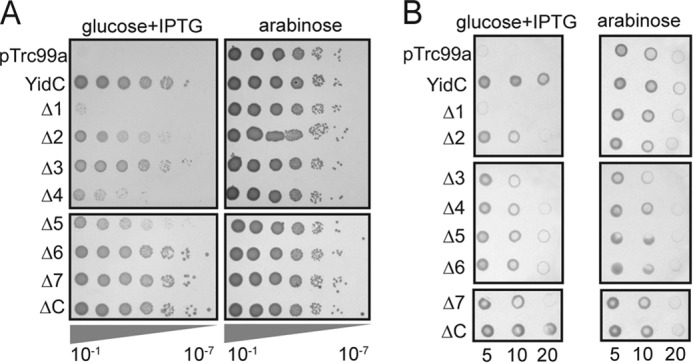
An in vivo activity analysis of E. coli YidC variants. A and B, growth complementation under aerobic (A) and anaerobic (B) conditions. In the presence of arabinose, all the cells exhibited similar growth phenotype (right panels). However, under the condition of glucose repression, differences of cell viability were manifested by a dilution series (left panels). pTrc99a, cells containing the empty vector pTrc99a (negative control); YidC, cells containing wild-type YidC (positive control); YidCΔ1–ΔC, cells containing the YidC variants.