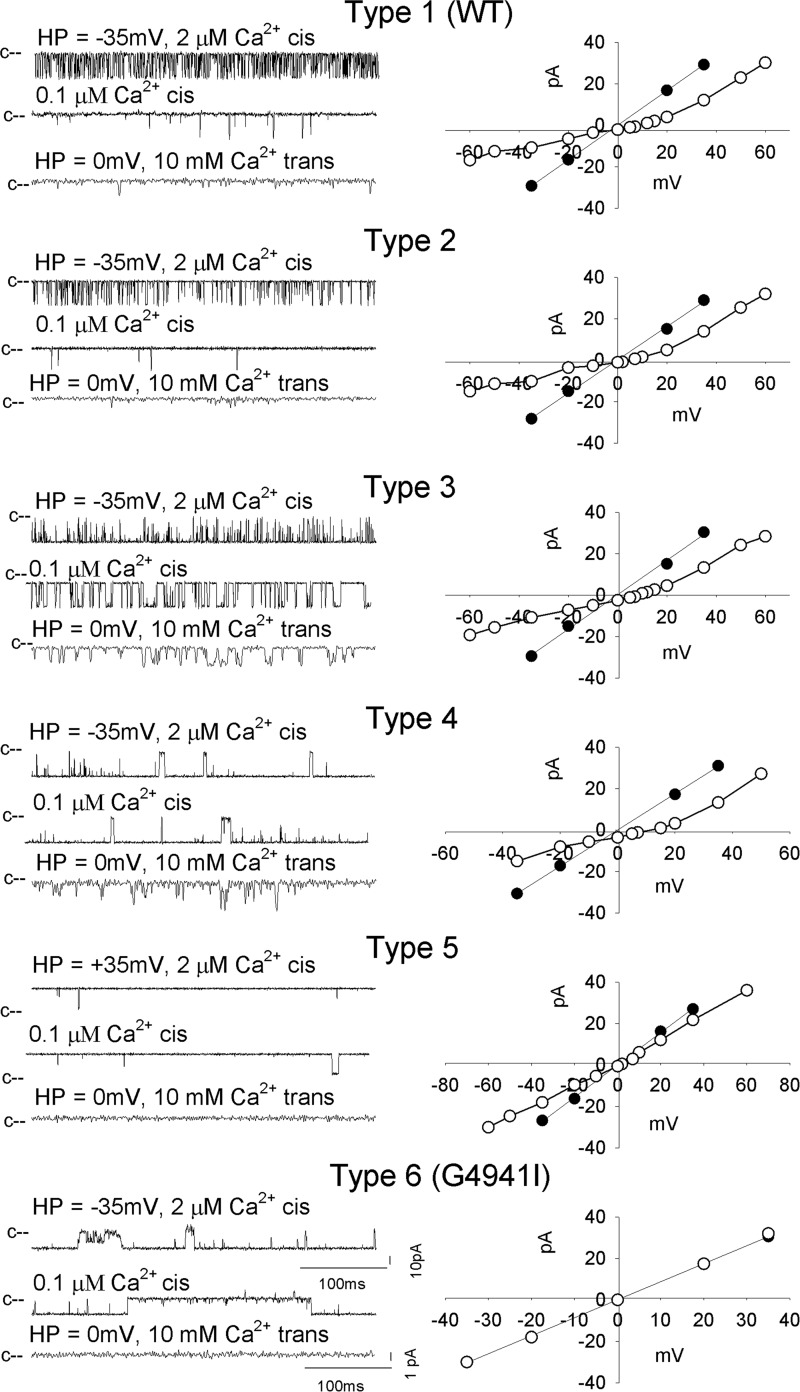
FIGURE 5.
Single channel measurements of homotetrameric and heterotetrameric RyR1-WT and -G4941I channel complexes. Representative single channel measurements were performed and analyzed as in Fig. 2. Current and time scales for single channel traces are as shown. Averaged Po values and ion permeation properties are summarized in Table 4.

