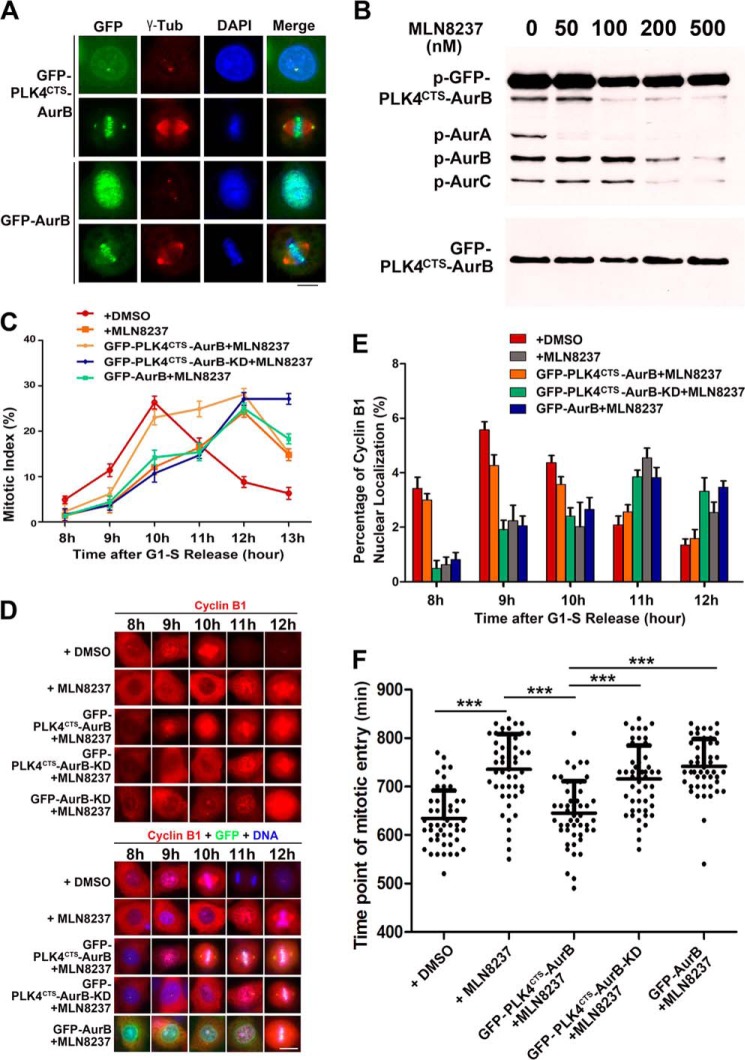
FIGURE 3.
Forced localization of Aurora B to centrosome could perform the function of Aurora A in promoting the mitotic entry. A, immunofluorescence photomicrographs of HeLa cells transfected with GFP-Aurora B or GFP-PLK4CTS-Aurora B (GFP-PLK4CTSAurB) and stained with a γ-tubulin (γ-tub) antibody. Note that GFP-PLK4CTS-Aurora B was localized to the centrosomes, whereas GFP-Aurora B was localized to the nucleus and the centromere in interphase and mitosis. Scale bar, 10 μm. B, HeLa cells transfected with GFP-PLK4CTS-Aurora B were synchronized to mitosis and treated with different concentrations of Aurora A inhibitor MLN8237 for 1 h. Cell extracts were subjected to immunoblot analysis with antibodies to phospho-Aurora A/Aurora B/Aurora-C and Aurora A. Note that the activity of Aurora A was inhibited by MLN8237 at 50 nm, whereas the activity of GFP-PLK4CTS-Aurora B was not affected. C, quantitative characterization of mitotic index of the cells expressed GFP-Aurora B, GFP-PLK4CTS-Aurora B, or GFP-PLK4CTS-Aurora B-KD. HeLa cells were synchronized to G1-S phase by thymidine block and released for 8–13 h. Before immunofluorescence analysis, 50 nm MLN8237 was added for 1 h. DMSO was used as solvent control. Each data point represents three independent experiments with each measuring 50 cells, and error bars indicate S.D. D and E, immunofluorescence staining and quantitative characterization of cyclin B1 nuclear localization in HeLa cells expressed GFP-Aurora B, GFP-PLK4CTS-Aurora B, or GFP-PLK4CTS-Aurora B-KD. HeLa cells were synchronized and treated with MLN8237 as in C and stained with cyclin B1 antibody. Cyclin B1 nuclear localization was defined by its staining and is stronger in the nucleus than in the cytoplasm. Each data point represents three independent experiments with each measuring 50 cells, and error bars indicate S.D. Scale bar, 10 μm. F, quantitative characterizations of time of mitotic entry. Cells expressed GFP-Aurora B, GFP-PLK4CTS-Aurora B, or GFP-PLK4CTS-Aurora B-KD were synchronized to G1-S phase by thymidine block and released followed by live cell imaging to measure the duration from the time point of G1-S phase release to nuclear envelope breakdown. n = 50 cells per group. ***, p < 0.001. Error bars indicate S.D.

