
FIGURE 4.
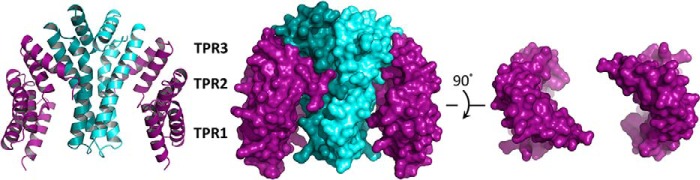
Structure of the FLUTPR-GluTRDD complex at 2.4 Å. Left, overall structure in ribbon representation; Middle, overall structure in surface representation. Two FLUTPR molecules are colored purple; one GluTRDD protomer is colored teal, and the other is in cyan. Right, FLUTPR structure in surface representation with GluTRDD not shown.