
FIGURE 6.
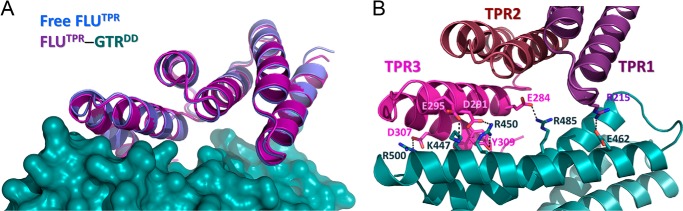
The FLUTPR-GluTRDD interaction. A, superimposition of FLUTPR in its free and GluTRDD-bound forms. GluTRDD is in surface representation. B, detailed FLUTPR-GluTRDD interactions. The individual TPR motifs are color-coded. Side chains of residues forming intermolecular salt bridge and hydrogen bond are shown as sticks. Salt bridge and hydrogen bond are shown as dashed lines.