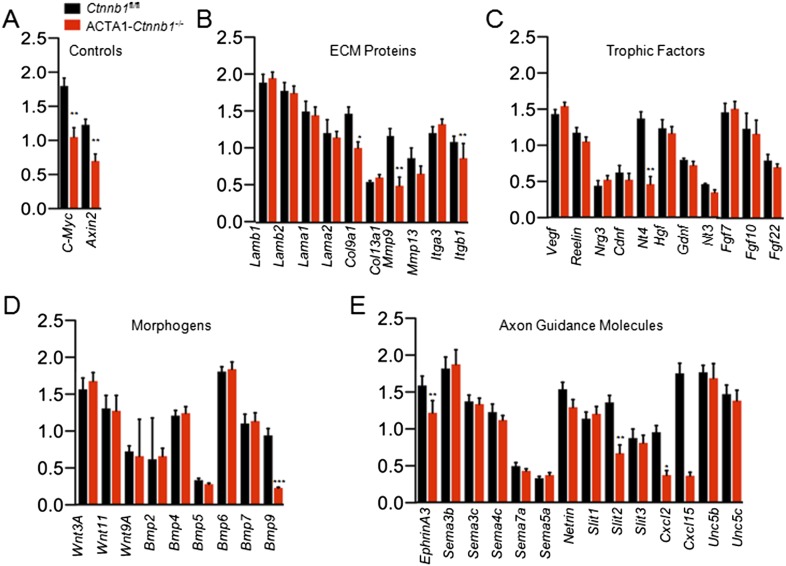
Figure 4. Slit2 was reduced in ACTA1-Ctnnb1−/− muscle.
RNA was purified from P0 muscles of Ctnnb1fl/fl (black) and ACTA1-Ctnnb1−/− (red) and subjected to quantitative real-time PCR. Of 70 genes, the expression of 25 was negligible. Shown were genes in different groups: known Ctnnb1 targets (A), ECM (extracellular matrix) proteins (B), trophic factors (C), morphogens (D), and environmental cues (E). Data are shown as mean ± SEM; *, p < 0.05; **, p < 0.01; ***, p < 0.001; t-test; n = 3.

