. 2015 Jul 10;4:e07266. doi: 10.7554/eLife.07266

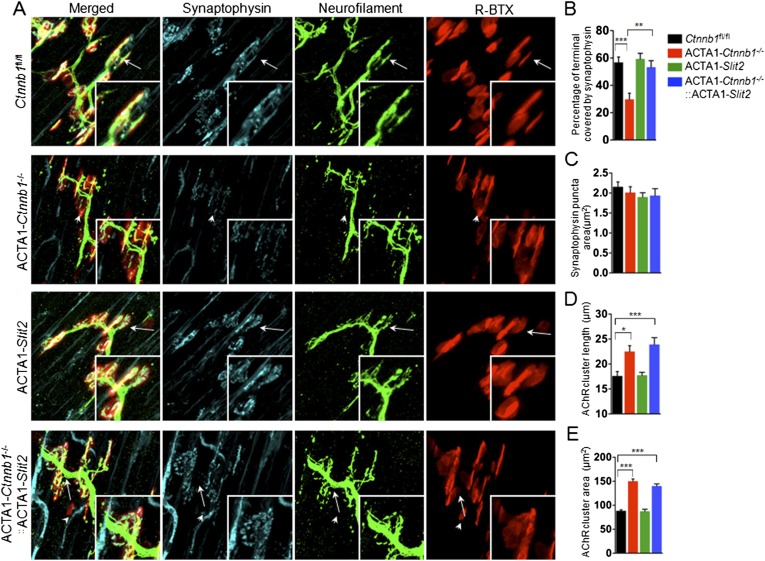
Figure 6. Slit2 overexpression increased synaptophysin staining at the NMJ.

P0 diaphragms of indicated genotypes were stained whole mount with R-BTX (red) and antibodies against neurofilament to label axons (green), and anti-synaptophysin antibody to label synaptic vesicles (cyan). (A) Representative images. Arrows indicate NMJs with synaptophysin; arrowheads indicate NMJ with reduced synaptophysin. (BE) Quantitative analysis of data in A. Data are shown as mean ± SEM; *, p < 0.05; **, p < 0.01; ***, p < 0.001; n = 9; One-way ANOVA; bar = 10 μm. NMJ, neuromuscular junction.

DOI: http://dx.doi.org/10.7554/eLife.07266.010

Figure 6.

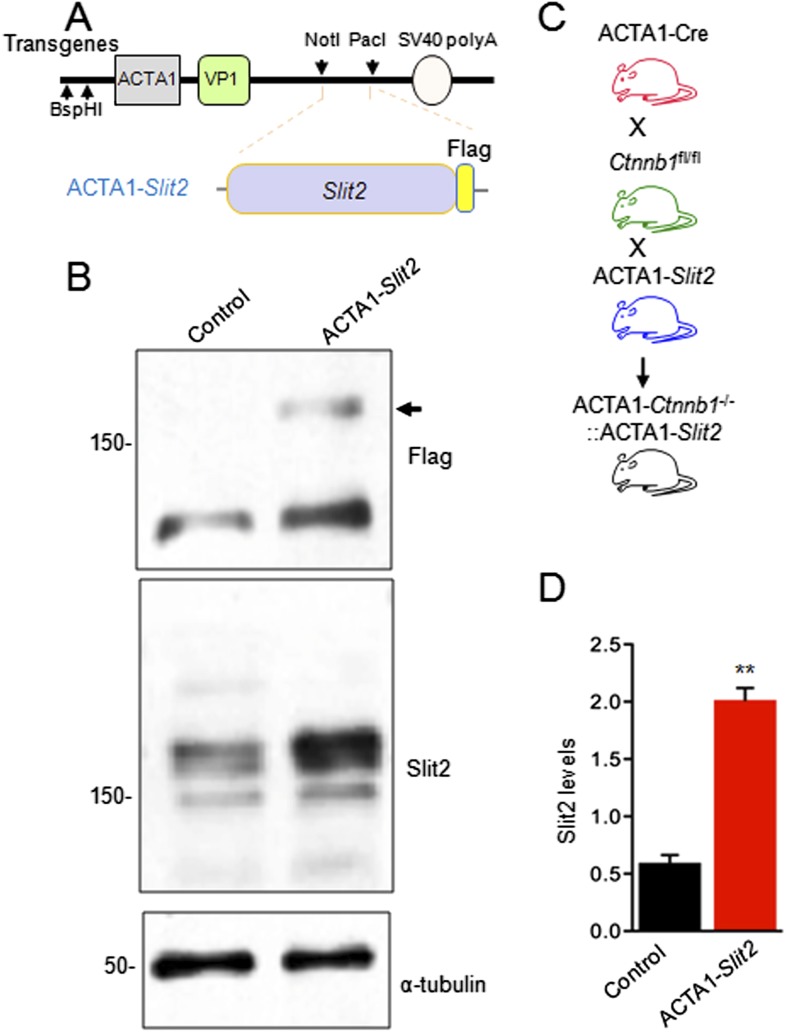
Figure 6—figure supplement 1. Generation of ACTA1-Slit2 transgenic mice.

Figure 6—figure supplement 1.

(A) Flag-Slit2 subcloned downstream of ACTA1 promoter used for the generation of ACTA1-Slit2 transgenic mice. (B) Breeding scheme to generate ACTA1-Slit2 mice. (C) Transgenic Slit2 expression was detected in the diaphragm muscles of ACTA1-Slit2 mice. (D) Quantitative analysis of C. Data are shown as mean ± SEM; **, p < 0.01; t-test.
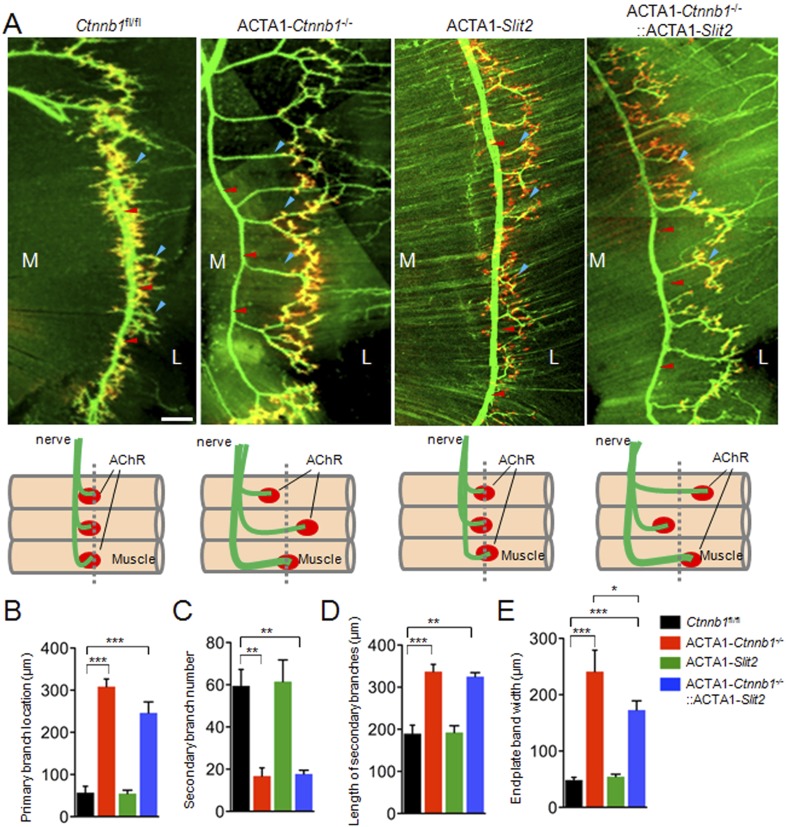
Figure 6—figure supplement 2. ACTA1-Slit2 partially rescues ACTA1-Ctnnb1−/− axon arborization defects.

Figure 6—figure supplement 2.

(A) Diaphragms of P0 mice of indicated genotypes were stained whole mount with R-BTX to label AChR clusters (red) and anti-NF/synaptophysin antibodies (green) to label axons and nerve terminals. Shown were left ventral areas. Red arrowhead, primary branches; blue arrowheads, secondary branches. M, medial; L, lateral; bar = 100 μm. Diagrams summarizing morphological deficits. (BE) Quantitative analysis of data in A. Data were shown as mean ± SEM; *, p < 0.05; **, p < 0.01; ***, p < 0.0001; One-way ANOVA; n = 4; bar, 50 μm.