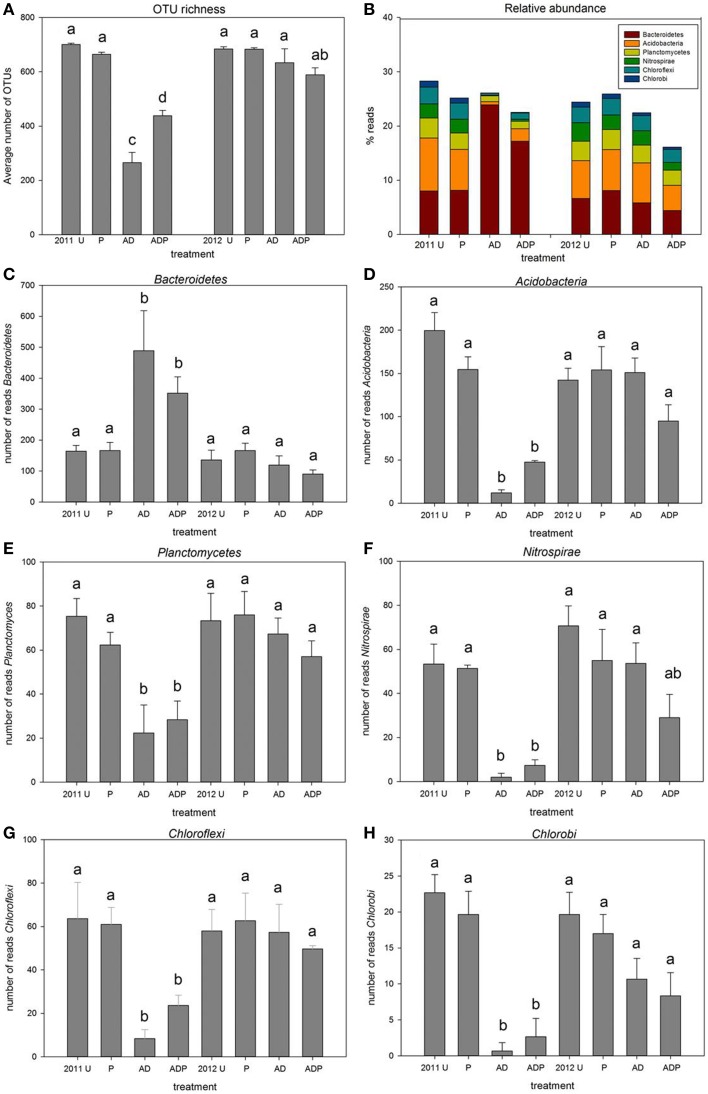
Figure 3.
OTU richness and average relative abundance of selected bacterial phyla. (A) average number of OTUs in differently managed soil (n = 3, error bars represent stdev, U, untreated; P, peat addition; AD, disinfestation), (B) relative abundance (C–H), average relative abundance of phyla that differ significantly between the disinfested soils in 2011 (AD and ADP) and all other treatments in 2011 and 2012.

