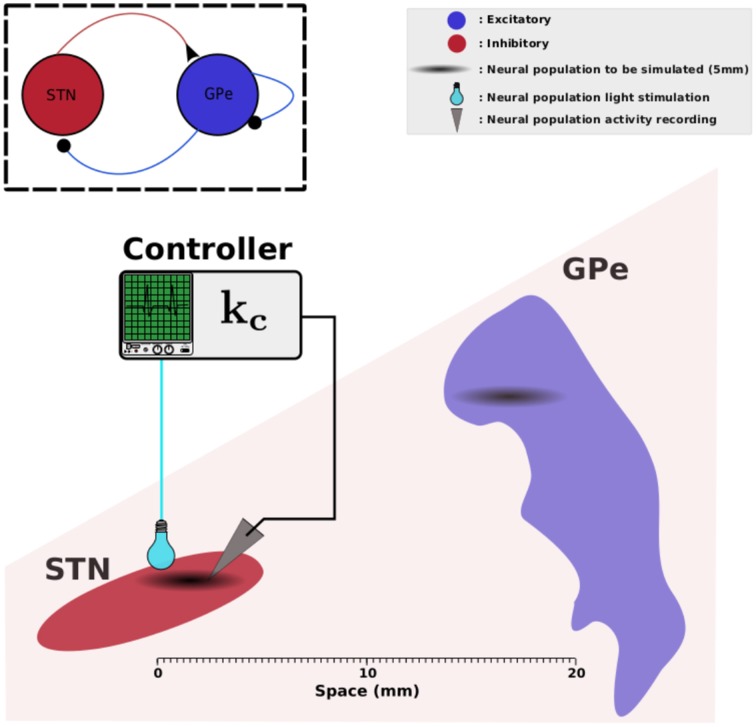
Figure 1.
STN-GPe network. This figure illustrates the physical arrangement of STN and GPe. We assume that the zones involved in pathological oscillations in STN and GPe measure 2.5 mm each (Zaidel et al., 2010); they are indicated in black clouds. The light-green box illustrates a controller that reads data from STN and applies a photostimulation to the same neural population. Elements of this figure have been found in Wikipedia and they are licensed according to CC (http://creativecommons.org/licenses/by-sa/3.0).

