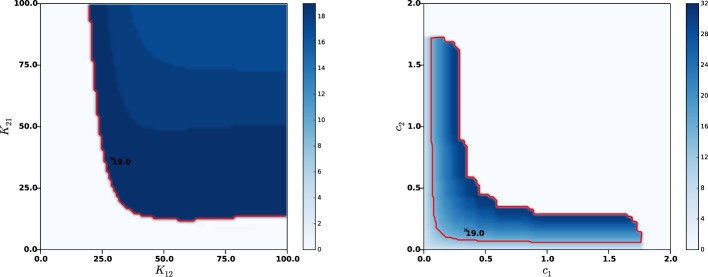
Figure 4.

Effects of synaptic strengths and axonal velocities on the frequency of oscillations. Left panel: main harmonic frequency of STN and GPe oscillations as a function of the synaptic distributions amplitudes K12 and K21 between STN and GPe (left panel) and as a function of the axonal propagation delays c1 and c2 (right panel). The red contour indicates β-band frequencies. The nominal values of the parameters are indicated with a black cross, together with the corresponding oscillations frequency.
