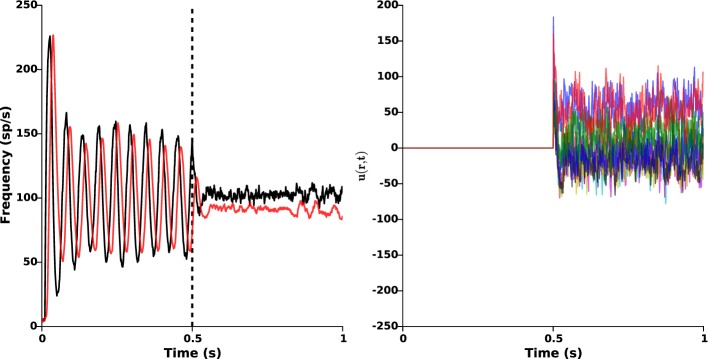
Figure 5.

Oscillations disruption. The left panel illustrates the disruption of pathological β-oscillations by applying the closed-loop stimulation signal with gain kc = 2 and target reference zref(r) = 0 from time t = 0.5 s. Red and black curves indicate the time evolution of the GPe and STN mean activities, respectively. Right panel shows the evolution of the control signal u(r, t) = −kc(z1(r, t) − zref(r)).
