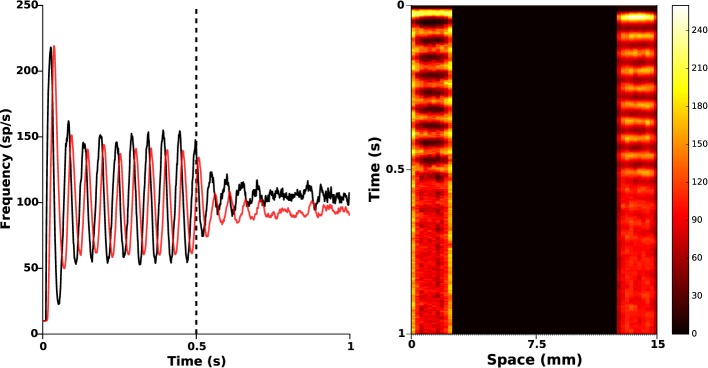
Figure 6.

Poor STN photosensitization. 50% of the function α(r) was randomly silenced. Closed-loop stimulation is applied from time t = 0.5 s with gain kc = 2 and target reference zref(r) = 0. Left: red and black curves illustrate time evolution of the mean activities of GPe and STN, respectively. It is apparent that the attenuation is not as successful as in Figure 5, but oscillations are still attenuated. Right: spatiotemporal evolution of the activity in STN (left) and GPe (right).
