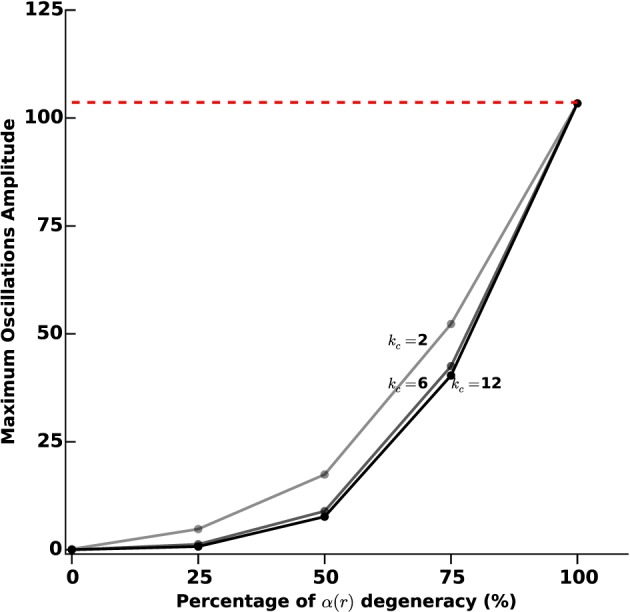
Figure 7.

Sustained oscillations amplitude vs. photosensitization degeneracy. We measure the efficiency of the proposed closed-loop stimulation through the amplitude of the remaining oscillations. We consider an increasing degeneracy of α(r), corresponding to an increasing number of STN neurons that do not respond to photostimulation. The three curves correspond to different values of the feedback gain kc (2, 6, and 12). The darkest curve corresponds to the highest value and the lighter one to the lowest value. The red dashed line indicates the oscillations maximum amplitude when no stimulation is applied.
