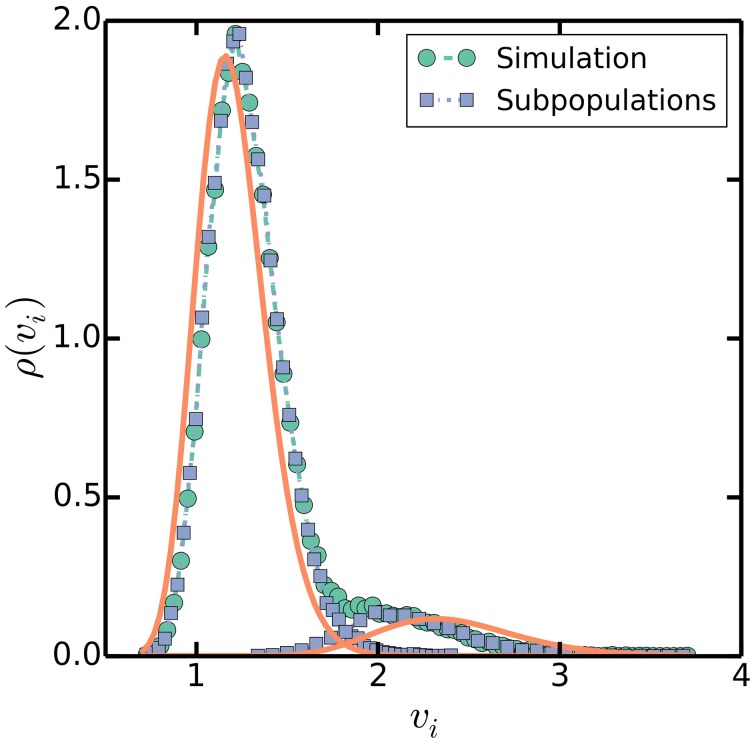
Figure 8.
Distribution of volumes at initiation. Simulations are as in Figure 3, with τ = 100 mins, C + D = 70 mins, and στ = 20 mins as a specific, slow growth example. Square symbols separate volumes at initiation into two subpopulations, one whose cells initiated the predicted number of rounds of replication at volumes near I0 Δ, and another whose cells initiated extra rounds of replication near twice that volume 2I0 Δ. Solid lines plot lognormal distributions with means I0Δ and 2I0Δ and variances σ2vi = 4σ2τ/3τ2 (Amir, 2014).

