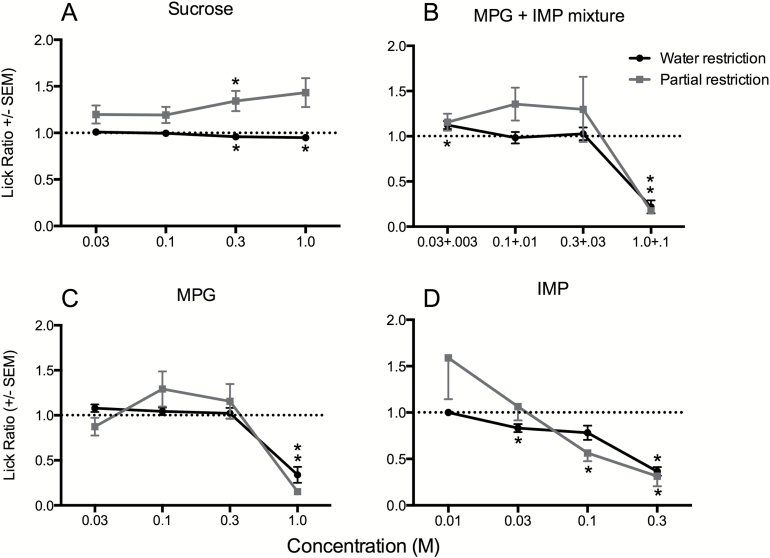
Figure 1.
Concentration response functions (mean LR ± SEM) for brief-access responses to sucrose (A), MPG + IMP mixture (B), MPG (C), and IMP (D) using either a water (black circles) or partial (gray squares) restriction procedure. The dotted line on each graph represents a ratio score of 1.0, which indicates a lick rate equal to that of water. Concentrations for the mixture (B) are the concentration of MPG + the concentration of IMP. Asterisks indicate statistically significant deviations from the water lick rate.

