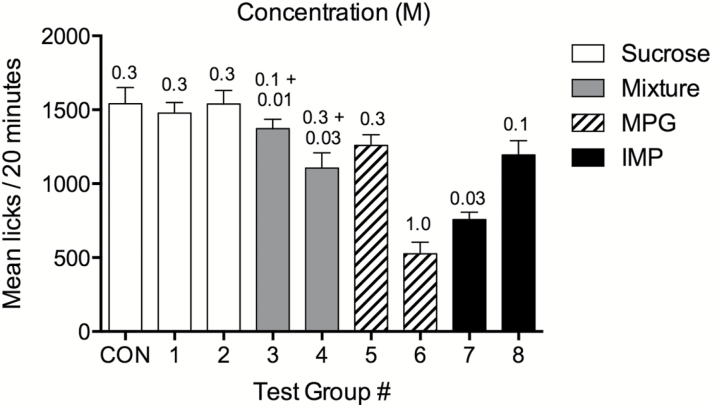
Figure 2.
Mean licks ± SEM for mice in response to sucrose, MPG + IMP mixtures, MPG, and IMP in the 20-min conditioning procedure. There were 9 groups of mice in the experiment, listed along the abscissa. The legend and bar pattern indicates which tastant mice licked and the concentrations are indicated above each bar.

