
Figure 3.
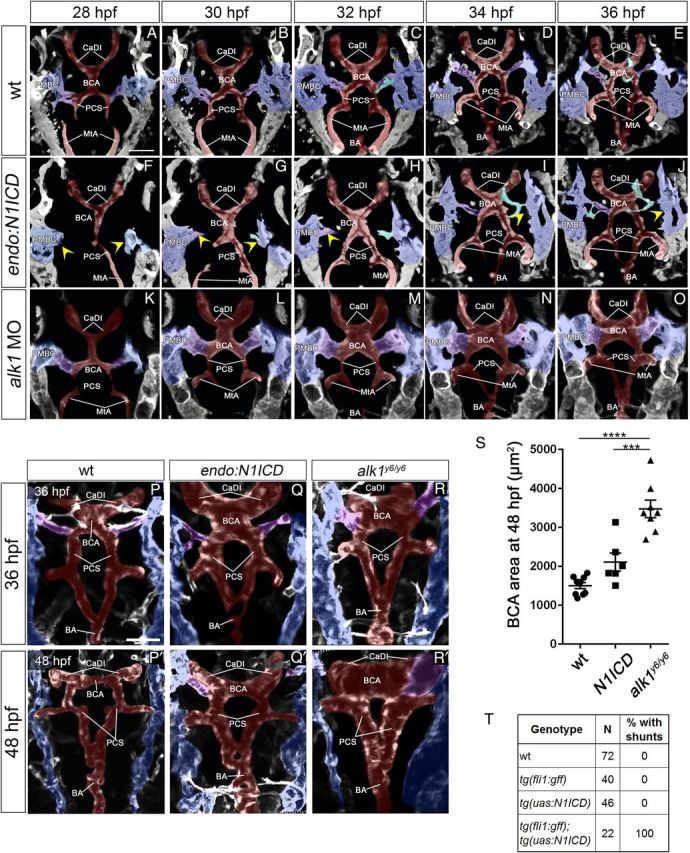
notchgof and alk1lof cranial AVMs have independent aetiologies. (A–J) Cranial arterial development in wt (A–E), Tg(endo:N1ICD) (F–J), and alk1 morphant (K–O) embryos, 28–36 hpf. See also Supplementary material online, Movies S4–S5. In Tg(endo:N1ICD) embryos (F–J), PMBC-derived sprouts (yellow arrowheads) are delayed, compromising CaDI/BCA drainage. In alk1 morphant embryos (K–O), connections form normally, but BCA enlargement is evident by 30 hpf. Two-dimensional projections of Z-stacks from two photon/confocal time-lapse imaging, frontal views, anterior up. Images represent N = 8 wt, 6 Tg(endo:N1ICD), 10 alk1 MO. Endothelial transgenes imaged: wt and Tg(endo:N1ICD), Tg(fli1a:GAL4FF;UAS:kaede); alk1 MO, Tg(fli1a:mrfp-caax)pt504. (P–R′) Two-photon imaging of wt (P, P′), Tg(endo:N1ICD) (Q, Q′), and alk1y6 mutant (R, R′) embryos at 36 and 48 hpf. Tg(endo:N1ICD) embryos show phenotypic overlap with alk1 mutants, with variable enlargement of the CaDI (36 hpf) and consistent retention of BCA/PMBC connections (48 hpf). Two-dimensional projections of Z-stacks, dorsal views, anterior up. Images represent N = 10 wt, 8 Tg(endo:N1ICD), and 8 alk1y6. Imaged transgene is Tg(kdrl:gfp)la116. (A–R) Pseudocolouring: PMBC (blue), CtA (cyan), CaDI/BCA/PCS/BA (red), BCA/PMBC connection (purple). Scale bars, 50 μm. (S) BCA area at 48 hpf. N = 6–9 for each condition; lines represent mean ± SEM. One-way ANOVA followed by Tukey's post-hoc test, ***P < 0.001, ****P < 0.0001. (T) Presence of shunts at 48 hpf.