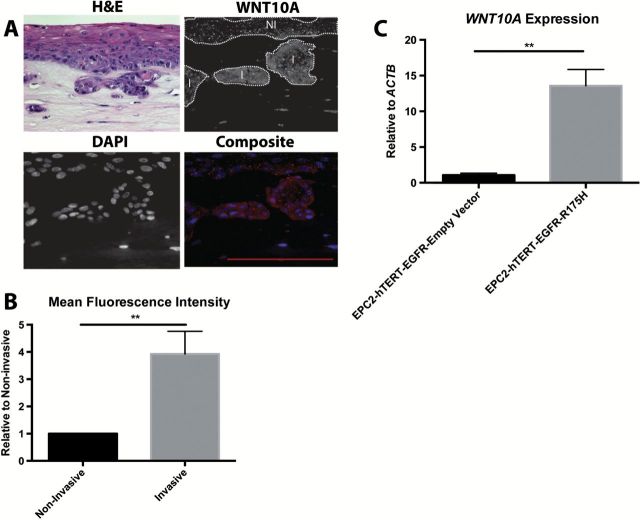
Figure 2.
WNT10A is upregulated in invasive esophageal cells. (A) Representative Hematoxylin and Eosin (H&E), WNT10A and DAPI staining of EPC2-hTERT-EGFR-p53R175H cells grown in 3-D OTC. Non-invasive (NI) and invasive (I) regions are delineated by white dots (B) Quantification utilizing ImageJ for mean fluorescent intensity of WNT10A staining in the non-invasive versus invasive front (n = 4 independent experiments). Fluorescent intensity of invasive front is relative to non-invasive regions. Bar graphs represent relative mean ± SEM. **P < 0.005 (paired Student’s t-test) (C) Quantitative reverse transcription–PCR of WNT10A expression relative to ACTB comparing non-invasive EPC2-hTERT-EGFR cells versus invasive EPC2-hTERT-EGFR-p53R175H cells (n = 3 experiments). Bar graph represents fold change ± SEM. **P < 0.005 (unpaired Student’s t-test).

