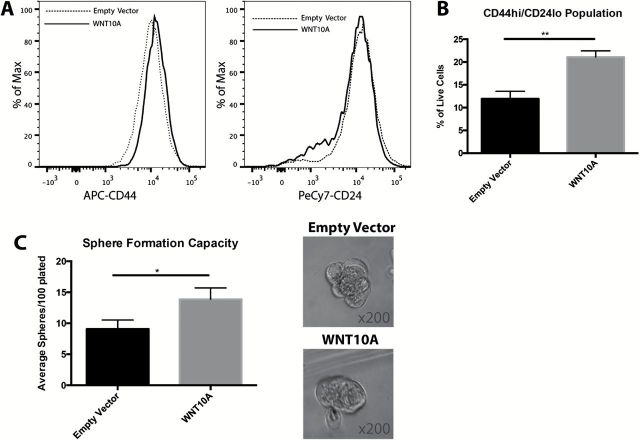
Figure 4.
WNT10A increases CD44High population and promotes self-renewal. (A) Representative histograms of CD44 and CD24 levels between empty vector and WNT10A cells, as expressed in a logarithmic scale. (B) Quantification of the CD44High/CD24Low population between empty vector and WNT10A cells (n = 3 experiments). Bar graphs represent fold change ± SEM within three different passages of cells within one representative experiment. **P < 0.005 (unpaired Student’s t-test). (C) Quantification of the average number of spheres formed per well between empty vector and WNT10A cells (n = 3 experiments in 96 replicates). Bar graph represents fold change ± SEM. *P < 0.05 (paired Student’s t-test). Representative images of the spheres from each cell type indicate no difference in the size of the spheres formed. Each image was taken at a magnification of ×200.

