
Figure 5.
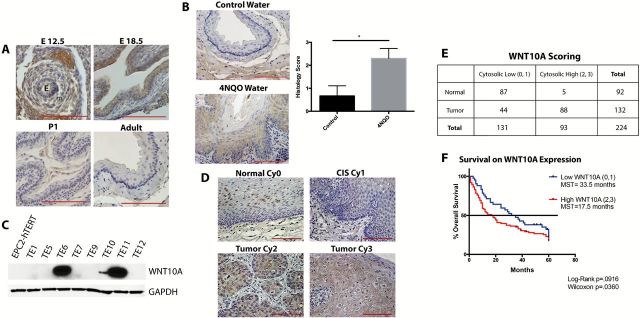
WNT10A is upregulated during esophageal development and in cancer. (A) WNT10A IHC of embryonic (E12.5, E18.5), postnatal day 1 (P1), and adult esophagus (E). Epithelial (e) and mesenchyme (m) are as indicated. (B) Representative WNT10A staining in esophagus of control mice versus mice treated with 10mg/ml of 4-NQO for 16 weeks. Downward growths and hyperplasia/dysplasia are indicative of early ESCC. Bar graph represents average scoring of esophagi ± SEM. *P < 0.05 (unpaired Student’s t-test) of three control and five experimental mice. (C) Western blot (cropped image) for WNT10A on a panel of ESCC human cell lines, as compared with normal, immortalized epithelial cells (EPC2-hTERT). (D) Representative images of WNT10A scoring classifications of adjacent normal (upper left panel) versus carcinoma in situ (CIS), and tumor tissue. Scoring was based on cytoplasmic intensity (Cy0, Cy1, Cy2 and Cy3). All scale bars are 100 μM. (E) Scoring stratified between low staining intensity (Cy0 and Cy1) and high staining intensity (Cy2 and Cy3) WNT10A staining between normal adjacent tissue and tumor sections, respectively P < 0.0001 (chi-squared test). (F) Kaplan–Meyer survival curve of tumor staining stratified between low WNT10A staining intensity versus high WNT10A staining intensity, with MST. P < 0.05 (Wilcoxon).