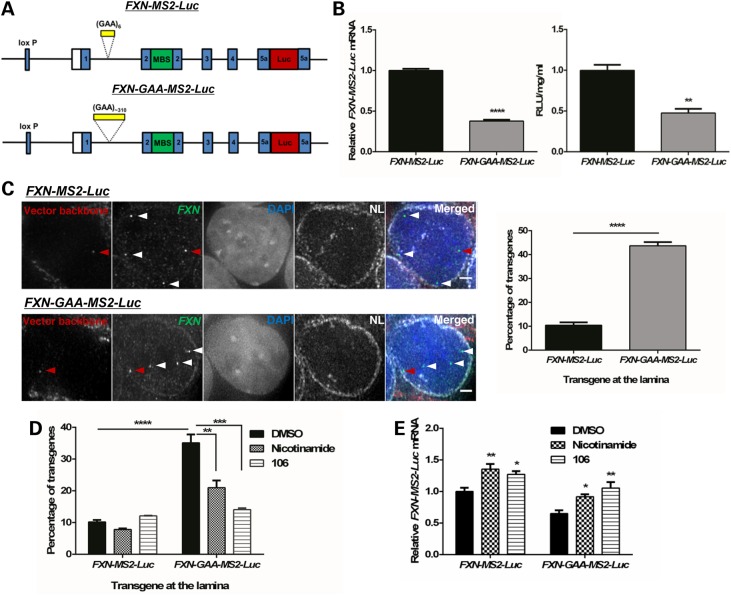
Figure 1.
The expanded GAA repeat FXN transgene associates with the NL more frequently in an FXN-GAA-MS2-Luc cell model. (A) Schematic representation of the pBAC-FXN-MS2-Luc and pBAC-FXN-GAA-MS2-Luc vectors. Each vector carries either six or ∼310 GAA repeats in intron 1, an array of 24 MBS in exon 2 and expresses an FXN-luciferase fusion protein. (B) FXN-MS2-Luc clone 2 and FXN-GAA-MS2-Luc clone 22 mRNA expression (left) was determined by qRT-PCR using qFXN-Luc primers and showed a significant reduction in FXN-GAA-MS2-Luc clone 22 mRNA levels, as determined by unpaired two-tailed Student's t-test (****P < 0.0001). Data are mean ± SEM (n = 3). Luciferase assay (right) showed a significant reduction in FXN-MS2-luciferase protein levels in FXN-GAA-MS2-Luc clone 22 cells, as determined by unpaired two-tailed Student's t-test (**P < 0.01). Data are mean ± SEM (n = 3). (C) 3D Immuno-FISH detection of FXN-MS2-Luc and FXN-GAA-MS2-Luc association with the NL (pseudocoloured white in merged image). Transgenes were identified by co-localization of FISH signals from FXN loci (green) and the vector backbone (red) in FXN-MS2-Luc and FXN-GAA-MS2-Luc cells (left). Nuclei were identified by DAPI staining (blue). Arrows show endogenous (white) and transgene (red) alleles. Comparison of the proportion of transgenes contacting the NL showed a significant difference in FXN-MS2-Luc and FXN-GAA-MS2-Luc cells (right) (****P < 0.0001, as determined by Fisher's two-tailed exact test, n = 140 cells per condition). Data are mean ± SEM from two independent FISH experiments. Association of FISH signals with the NL was analysed using ImageJ: image stacks were analysed manually, and association was determined by eye when FXN FISH signals were touching or superimposing the NL signal at a given z-section. Images are maximum projections of z-stacks covering the signals. Scale bar: 2 µm. (D) Treatment with nicotinamide (10 mm) or compound 106 (10 µm) for 48 h significantly decreased FXN-GAA-MS2-Luc interaction with NL (**P < 0.01, ***P < 0.001, ****P < 0.0001, as determined by Fisher's two-tailed exact test, n = 140 cells per condition). Data are mean ± SEM from 2–3 independent FISH experiments. (E) FXN-MS2-Luc mRNA expression after incubation with HDACi for 48 h was determined by qRT-PCR using qFXN-Luc primers (25). Data were normalized to GAPDH mRNA levels. Results are relative to FXN-MS2-Luc DMSO. Two-way analysis of variance (ANOVA) with Sidak's correction test showed a significant difference in the two cell lines when comparing with the DMSO control of each line (*P < 0.05; **P < 0.01). Data are mean ± SEM from three independent experiments.

