Figure 2.
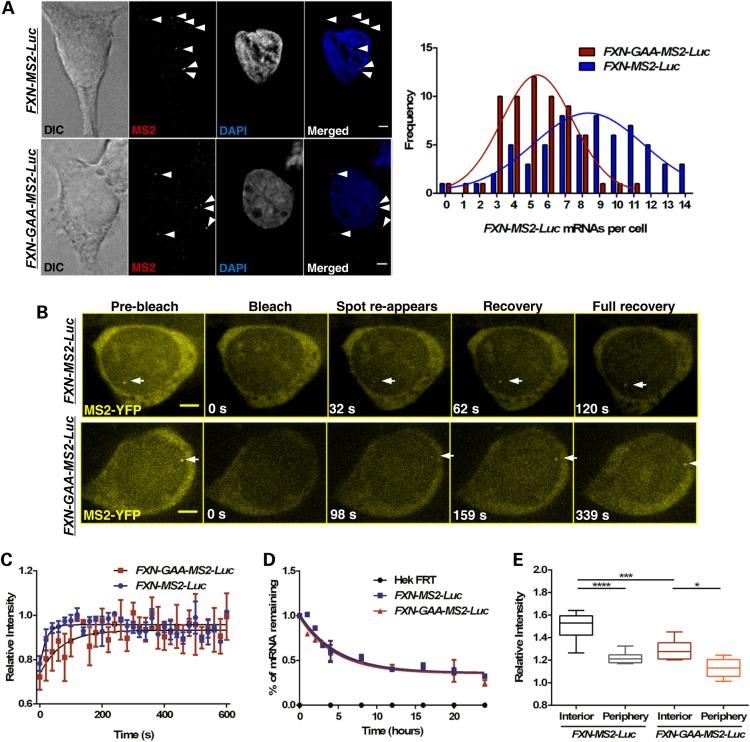
The GAA repeat expansion reduces FXN-GAA-MS2-Luc transcriptional output and impedes transcription in fixed and living FXN-GAA-Luc cells. (A) Quantification of FXN-MS2-Luc mRNA molecules in FXN-MS2-Luc and FXN-GAA-MS2-Luc cells by RNA FISH. FXN-MS2-Luc mRNA molecules were identified as sharp dots (arrows) above background of non-specific fluorescence using an MS2-Cy3 probe (red in merged images) in FXN-MS2-Luc (top images) and FXN-GAA-MS2-Luc (bottom images) cells. Nonlinear regression curve-fit comparison showed a significant difference between the distribution of FXN-MS2-Luc mRNA molecules in FXN-MS2-Luc and FXN-GAA-MS2-Luc cells (P < 0.0001, F = 33.31, d.f. = 3, 21, n = 63 cells per line) (right). Images are maximum projections of z-stacks covering the signals. (B) Live-cell fluorescence video frames taken before and at indicated times after photobleaching of the transcription site. Scale bar: 2 µm. (C) FRAP recovery curves and fitted exponential curves show a difference in transcription kinetics (P = 0.0048, F = 4.434, d.f. = 3, 210, n = 5 cells per line). (D) Degradation of FXN-MS2-Luc mRNA was analysed by qRT-PCR using qFXN-Luc primers in FXN-MS2-Luc and FXN-GAA-MS2-Luc cells after treatment with Actinomycin D for 24 h. Data were normalized to β-actin mRNA. Comparison of fitted exponential decay curves shows no difference between the two cell lines (P = 0.5979, F = 0.6351, d.f. = 3, 32). FXN-MS2-Luc mRNA half-life was ∼4 h. Data are mean ± SEM (n = 3). (E) Quantification of fluorescence intensities of active transgenes in living FXN-MS2-Luc and FXN-GAA-MS2-Luc cells. Spot intensity of active FXN transgenes above MS2-YFP background was significantly lower in the nuclear interior in FXN-GAA-MS2-Luc cells when compared with FXN-MS2-Luc cells (***P < 0.001), and significantly lower when alleles were expressing at the periphery than in the nuclear interior in the two cell lines, as determined by one-way ANOVA with Sidak's multiple comparisons test (****P < 0.0001, *P < 0.05, n = 15 cells per line).

