Figure 4.
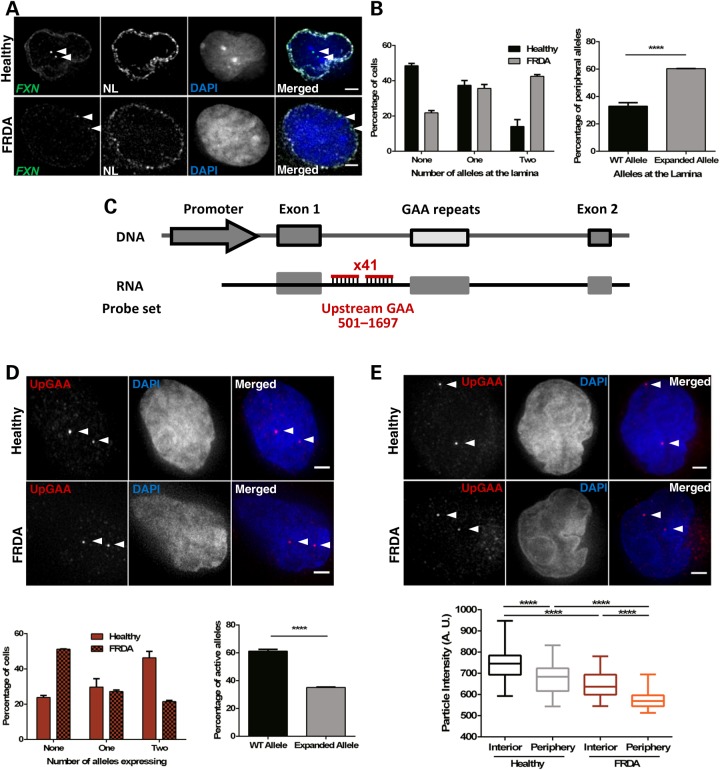
GAA repeat expansion increases FXN localization at the NL, reduces the number of active FXN alleles and downregulates transcription from active FXN in FRDA cells (GM16209). (A) 3D Immuno-FISH detection of FXN loci association with the NL in healthy (top images) and patient-derived (bottom images) cells. Each allele was detected with a DNA probe for FXN (green in merged image), and the NL was detected with an antibody for Lamin B1 (white). Nuclei were identified by DAPI staining (blue). Arrows indicate alleles. Association of FISH signals with the NL was analysed using ImageJ: image stacks were analysed manually and the association was determined by eye when FXN FISH signals were touching or superimposing the signal from the NL at a given z-section. (B) Histogram (left) showing the distribution of cells with FXN FISH signals contacting with the NL was significantly different in the two cell lines, as determined by Chi-squared test (P < 0.0001, χ2 = 63.056, d.f. = 2). When data were analysed at allele level instead of cell level (right), the proportion of FXN alleles positioned at the NL is significantly different when comparing the localization of the expanded and normal FXN alleles (****P < 0.0001, as determined by Fisher's two-tailed exact test). (C) Schematic representation showing the relative position to TSS and labelling of the DNA oligo probe set used in nascent RNA FISH experiments. (D) Nascent RNA FISH detection of FXN expression in healthy and patient-derived cells (top). Each allele was detected with a mix of 41 DNA oligos hybridizing with the region upstream of the GAA repeats (pseudocoloured red in merged image). Histogram (bottom left) showing the distribution of cells with RNA FXN FISH signals was significantly different in the two cell lines, as determined by Chi-squared test (P < 0.0001, χ2 = 75.424, d.f. = 2). When data were analysed at allele level instead of cell level (bottom right), the proportion of active FXN alleles is significantly different when comparing the expanded and normal FXN alleles (****P < 0.0001, as determined by Fisher's two-tailed exact test). Data are mean ± SEM from three independent hybridizations (n = 187–202 cells). (E) Nascent RNA FISH detection of FXN expression in healthy and patient-derived cells (top) showing different signal intensities of internal versus peripheral nascent RNA loci. Detection was performed as described in (D). Box plot (bottom) showing the RNA FISH spot intensity of active FXN alleles above the threshold was significantly lower in the interior and at the periphery in FRDA versus healthy nuclei (****P < 0.0001) and significantly lower when alleles were expressing at the periphery than in the nuclear interior in the two cell lines, as determined by one-way ANOVA with Tukey's multiple comparisons test (****P < 0.0001, n = 245 signals). Images are maximum projections of z-stacks covering the signals. Scale bar: 2 µm.

