Figure 5.
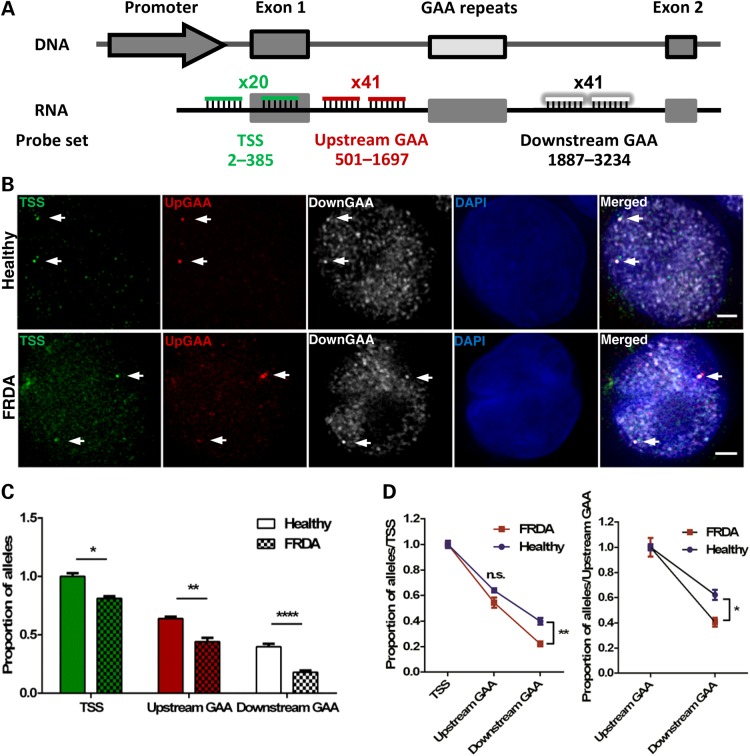
GAA repeat expansion disrupts transcription initiation and elongation in FRDA cells (GM16209). (A) Schematic representation showing the relative position to TSS and labelling of the three DNA oligo probe sets used to detect transcription initiation and elongation in RNA FISH experiments. (B) FXN RNA FISH detection of transcription initiation after the transcription starting site (TSS probe set in green) and elongation through the regions upstream (pseudocoloured red) and downstream (pseudocoloured white) of the GAA repeats. Nuclei were identified by DAPI staining (blue). Arrows indicate alleles. Images are maximum projections of z-stacks covering the signals. Scale bar: 2 µm. (C) Data were normalized to the TSS of healthy cells. When compared with the same region in healthy alleles, expanded FXN alleles showed a ∼19% decrease at the TSS, a ∼20% and a ∼22% decrease at the regions upstream and downstream of GAA repeats, respectively. This data demonstrates GAA repeat expansions reduce FXN transcription initiation by 19% and elongation downstream of expanded GAA repeats by 3% (*P = 0.0119, **P = 0.003, ****P < 0.0001, as determined by Fisher’'s two-tailed exact test, n = 218–226 cells per line). Data are mean ± SEM from three independent FISH experiments. (D) Data of each line in (C) were normalized to their TSS, thus excluding the effect of transcription initiation (left) and elongation through the region upstream of GAA repeats (right). Expanded FXN alleles show a significant difference in the region downstream of the GAA repeats when comparing with the same region in healthy alleles (*P < 0.05, **P < 0.01, as determined by two-way ANOVA with Sidak's multiple comparisons test). Data are mean ± SEM from three independent FISH experiments.

