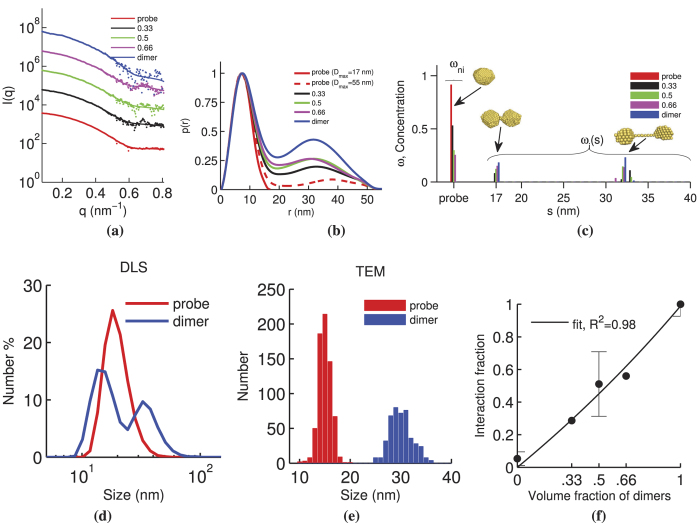
Figure 5. Proof-of-concept experimental results for the interaction model system corresponding to five samples with different volume fractions of dimer solution (0.00, 0.33, 0.50, 0.66, and 1.00).
(a) 1D SAXS scatter plot of data (points) with approximated fits (solid lines). Each curve is offset by a factor of 10 for clarity. (b) p(r) derived from (a) computed with an estimated maximum distance parameter (Dmax) of 17 and 55 nm, the latter for comparison with mixtures and dimer p(r). (c) Concentration of non-interacting (ωni) and interacting model species (ωi) derived from (a). Bead models of three selected basis functions (Ini(q), Ii(q,17), and Ii(q,32)) are shown at their respective spacing locations on the ω distribution. The range of s used for basis functions was from 17 to 50 nm. (d) DLS results from probe and dimer solution. (e) TEM histogram for probe diameters and maximum dimer dimensions. (f) Interaction fraction,  , for five samples with differing volume fractions of dimer solution and the fit from Eq. (8).

